61% of US Adults Do Not Oppose Bitcoin as Legal Tender, Survey Shows
Publikováno: 12.9.2021
 Following El Salvador making bitcoin legal tender, a survey was conducted to ascertain whether U.S. adults support or oppose a similar move in the U.S. Among 4,912 adults who participated, 61% did not oppose. Majority of Adults in US Do Not Oppose Making Bitcoin Legal Tender, Survey Shows Yougov America Inc. conducted a survey Thursday […]

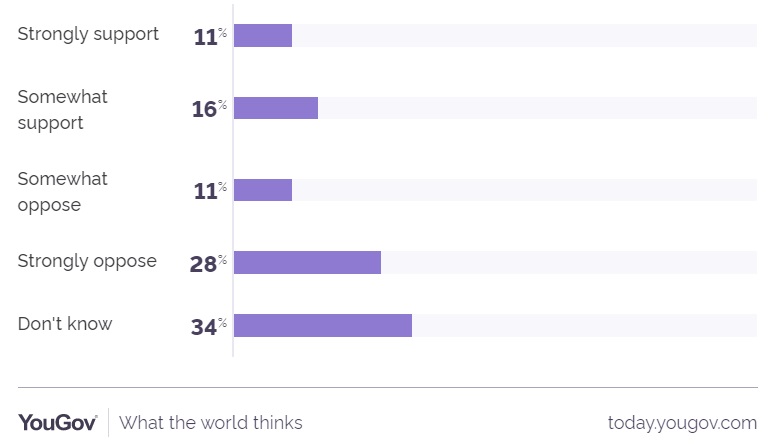
Following El Salvador making bitcoin legal tender, a survey was conducted to ascertain whether U.S. adults support or oppose a similar move in the U.S. Among 4,912 adults who participated, 61% did not oppose.
Majority of Adults in US Do Not Oppose Making Bitcoin Legal Tender, Survey Shows
Yougov America Inc. conducted a survey Thursday to ascertain whether consumers are for or against adopting bitcoin as legal tender in the U.S. A total of 4,912 adults in the country participated in the survey. Yougov is an international research data and analytics group headquartered in London.
Survey respondents were asked: “Would you support or oppose the U.S. making bitcoin a legal form of currency? This would mean that businesses would accept bitcoin in exchange for goods and services, in addition to continuing to accept the U.S. dollar.”
According to the results, 11% said they “strongly support” and 16% said they “somewhat support.” Meanwhile, 11% said they “somewhat oppose,” 28% said they “strongly oppose,” and 34% said they “don’t know.”

Among male respondents, the number of people who strongly support making bitcoin legal tender rises to 15% and 17% said they somewhat support. Among female respondents, only 7% strongly support and 14% somewhat support.
The top age groups that strongly support BTC as legal tender in the U.S. are 25-34 (20%) and 35-44 (19%). Meanwhile, 26% of the 18-24 age group and 24% of the 25-34 age group somewhat support.
What do you think about this survey? Let us know in the comments section below.