Bitcoin Stock-to-Flow Model Still Intact — ‘Starting to look like 2013’ S2F Creator Says
Publikováno: 1.6.2021
 The creator of the popular bitcoin price model called stock-to-flow (S2F or S2FX) has added a new dot to his notorious chart. Plan B said on Tuesday that “we knew bitcoin would not go up in a straight line” and added that the market action is “starting to look like 2013.” S2FX ‘Intact’ Says Plan […]

The creator of the popular bitcoin price model called stock-to-flow (S2F or S2FX) has added a new dot to his notorious chart. Plan B said on Tuesday that “we knew bitcoin would not go up in a straight line” and added that the market action is “starting to look like 2013.”
S2FX ‘Intact’ Says Plan B
“Plan B,” is a pseudonym leveraged by the Twitter account @100trillionusd and since March 22, 2019, he’s been documenting his popular stock-to-flow (S2F) price model. Similar to the tools and technical analysis models Bitcoin.com News has written about in recent days like the Golden Ratio Multiplier and Logarithmic Growth Curves, Plan B’s model is extremely popular and he recently updated it to the stock-to-flow cross-asset (S2FX) model.
Basically, the model quantifies BTC’s scarcity in a similar fashion to scarce assets like gold. It then leverages the bitcoin in circulation and quantifies it by yearly issuance with reward halvings as well.

At the time of publication, the Bitcoin network’s inflation rate per annum is approximately 1.77% and a circulating supply of 18,723,781 BTC. Despite bitcoin losing 53% from it’s all-time high of over $64k to a low of $30k in 30 days, Plan B still confirms the S2FX model is “intact.” Moreover, current charts look awfully familiar as Plan B expressed that things are looking like 2013 right now.
“New dot: May close $37,341.. -35% .. we knew bitcoin would not go up in a straight line and several -35% drops are possible (and indeed likely) in a bull market,” Plan B tweeted. “Starting to look like 2013. S2F(X) model intact,” the popular Twitter account told his 523,000 followers. Plan B further added:
2nd bounce off the lower band of S2F model. Will S2F break? Or will this turn out to be an excellent buy signal? I know multiple hedge funds that actually trade this BTC-S2F ‘cointegration’ (despite that we can’t formally use cointegration tests because S2F ratio isn’t random).
Plan B Asks Will S2F Break or Is This a Buy Signal?
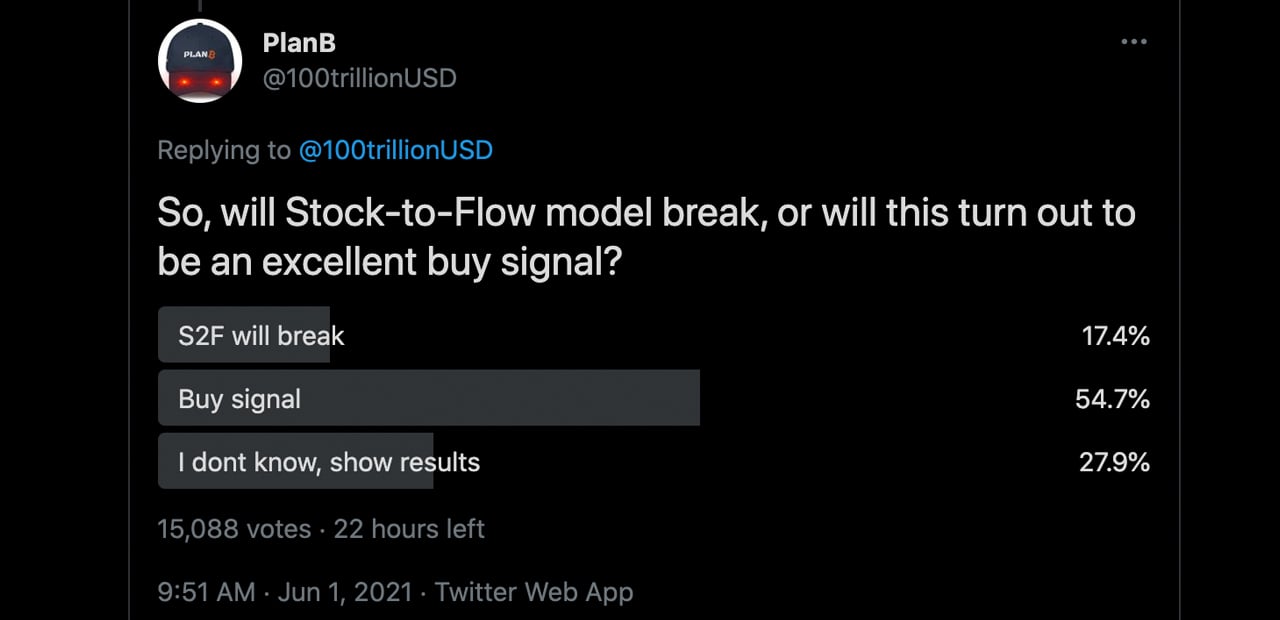
Moreover, Plan B also started a poll on Twitter that asked his followers if they thought the S2F model would break or will it turn out to be an excellent buy signal. Out of over 15,000 votes so far, 54.7% think it’s a “buy signal,” while 17.4% think “S2F will break.” One individual responded and said BTC would go “back to $20k and bounce.” Others who believe its an excellent “buy signal,” said the question was a “no brainer.”

Plan B was also asked “How do you define break? 2stdev or 1stdev band?” The S2F creator responded and noted: “Let’s say break out of the 1stdev band and stay below $100k this year. i.e. 1 outlier will not break it, but structurally below model breaks it. Formulas and stats are in the s2f paper, so you could define it better.”
Bitcoin prices tried to surpass $38k this past weekend but bulls have failed to push the value past that range. Plan B is not the only market observer that has said the current market cycle looks like “2013.” On May 23, Bitcoin.com News reported on a number of traders and crypto proponents who believe the current cycle is very similar to 2013’s double top bull run.
What do you think about Plan B’s updated S2F chart with the new dot? Do you think S2F break? Let us know what you think about this subject in the comments section below.