BTC’s Market Share Drops Consecutively for 14 Days – Dominance Ratio Slides to 60%
Publikováno: 15.2.2020
 Cryptocurrency markets have been climbing higher in value as coins like BTC have gained over 19% during the last 90 days. However, many other digital assets have seen much larger gains and BTC dominance has been sliding downwards consecutively for the last 14 days. Also Read: Craig Wright’s $100B Theft Claim – BTC and BCH […]
The post BTC’s Market Share Drops Consecutively for 14 Days – Dominance Ratio Slides to 60% appeared first on Bitcoin News.

Cryptocurrency markets have been climbing higher in value as coins like BTC have gained over 19% during the last 90 days. However, many other digital assets have seen much larger gains and BTC dominance has been sliding downwards consecutively for the last 14 days.
Also Read: Craig Wright’s $100B Theft Claim – BTC and BCH Used His Database Without Permission
BTC’s Ratio of Market Dominance Sinks to 60%
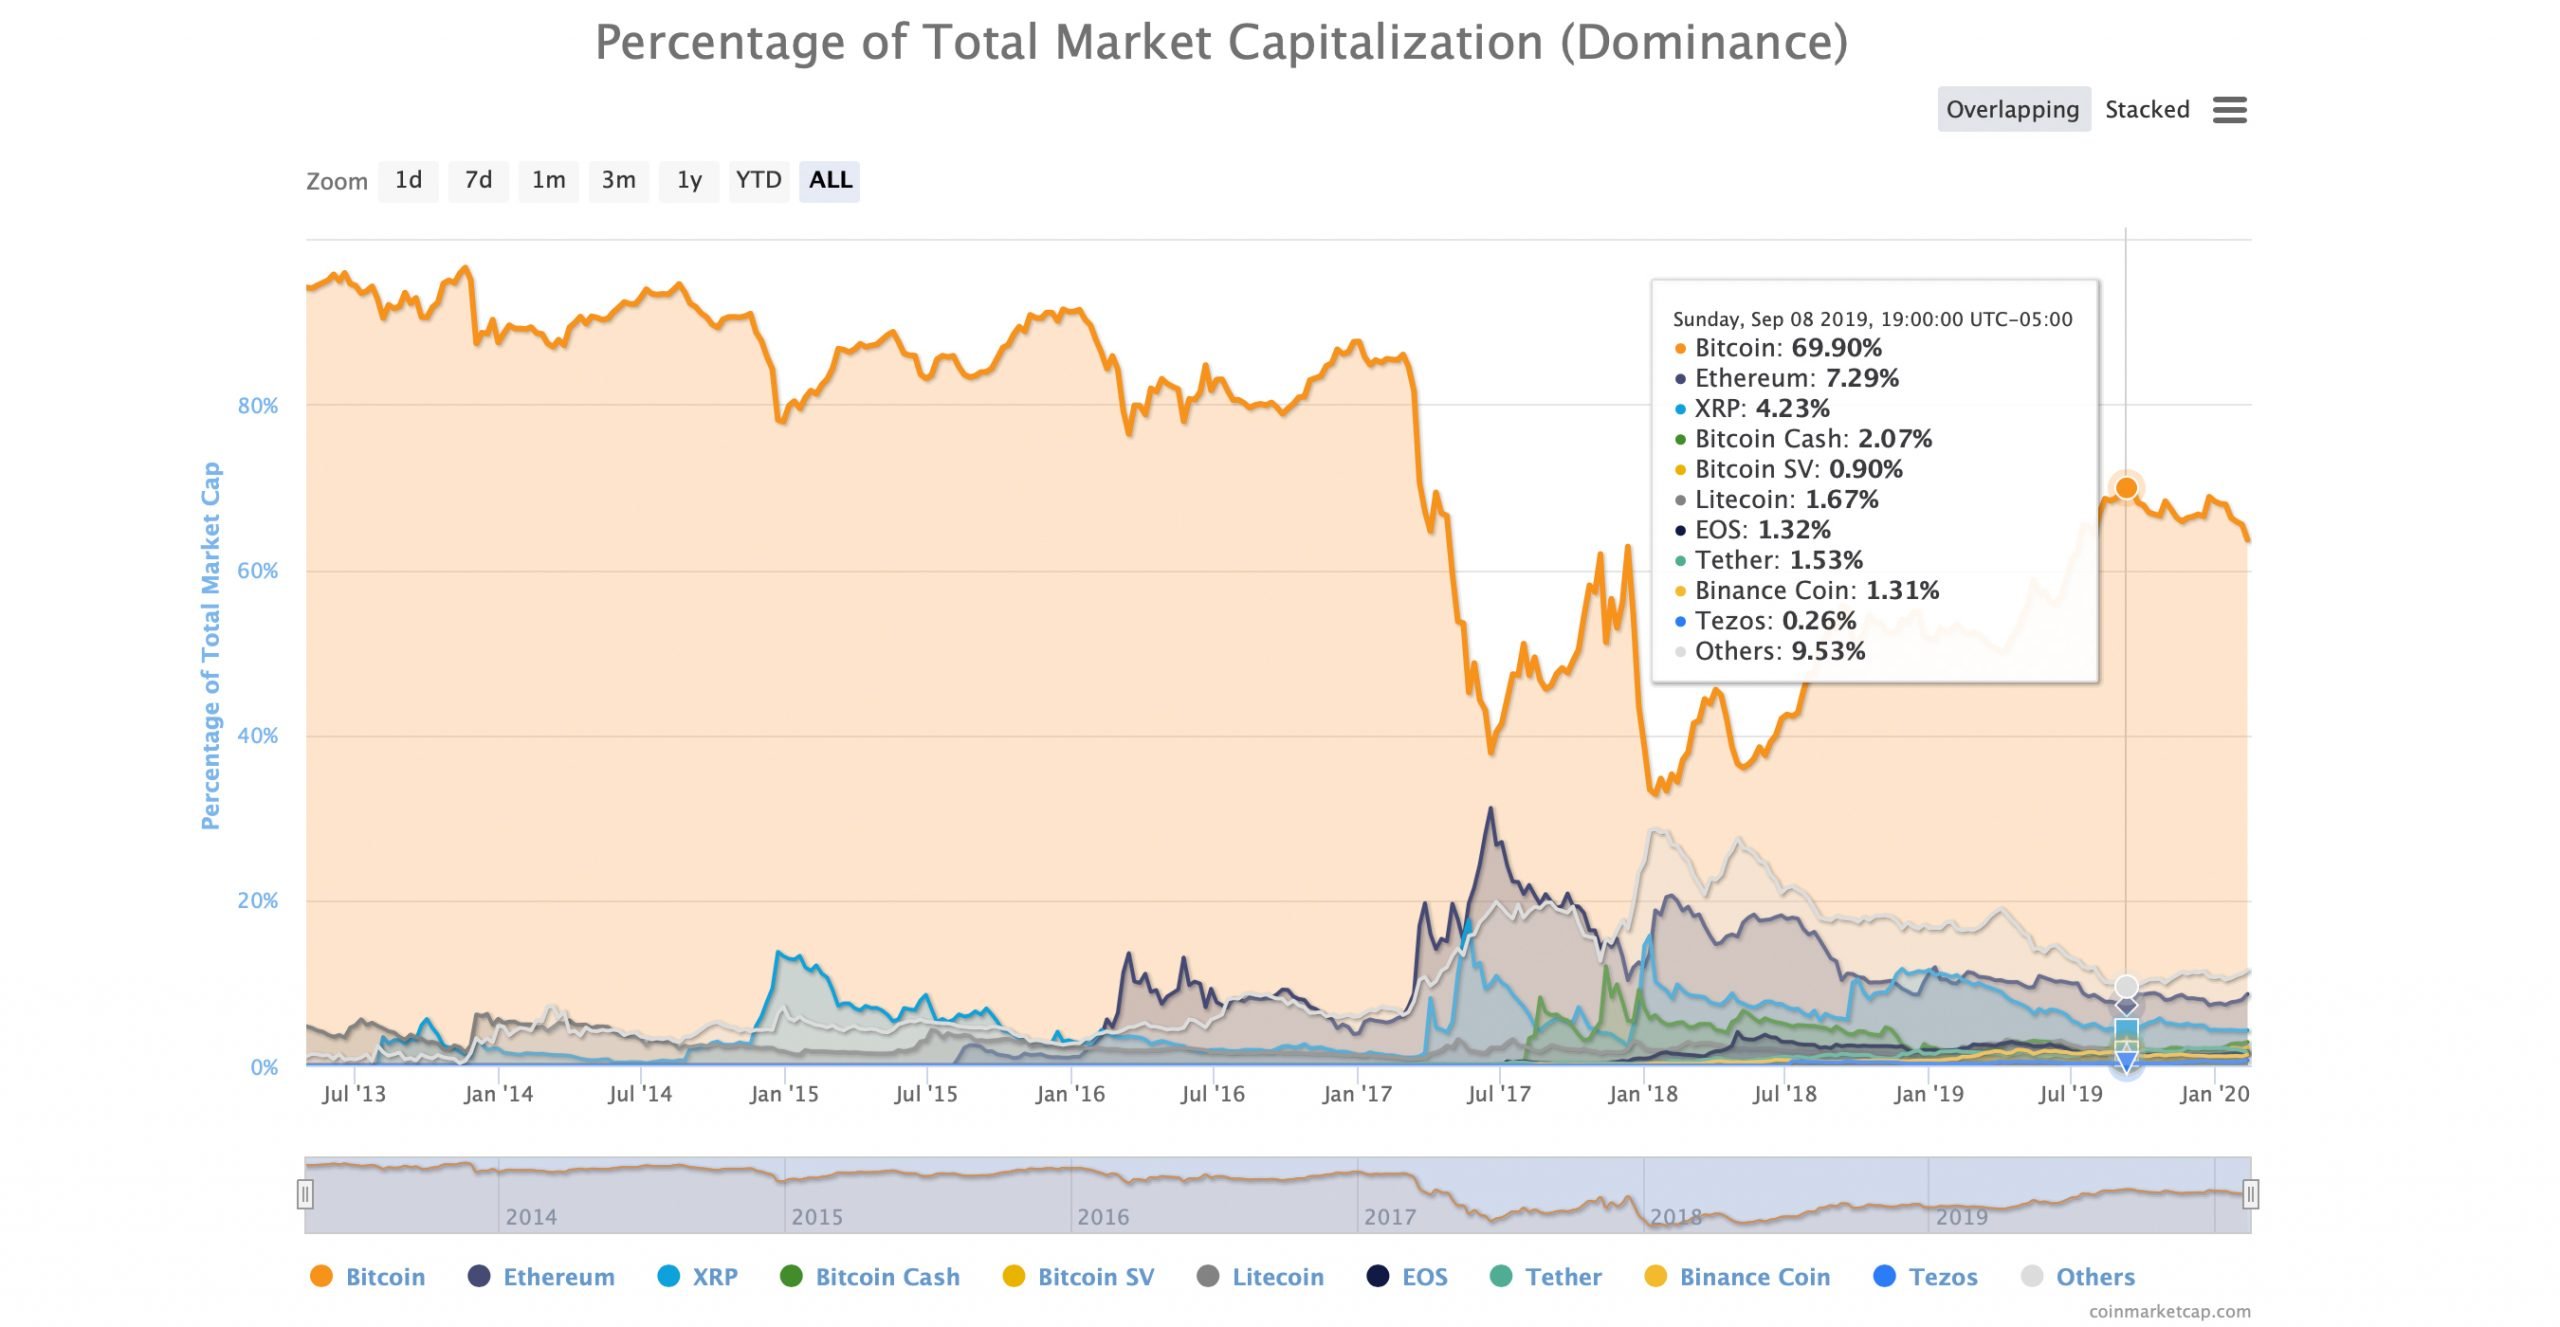
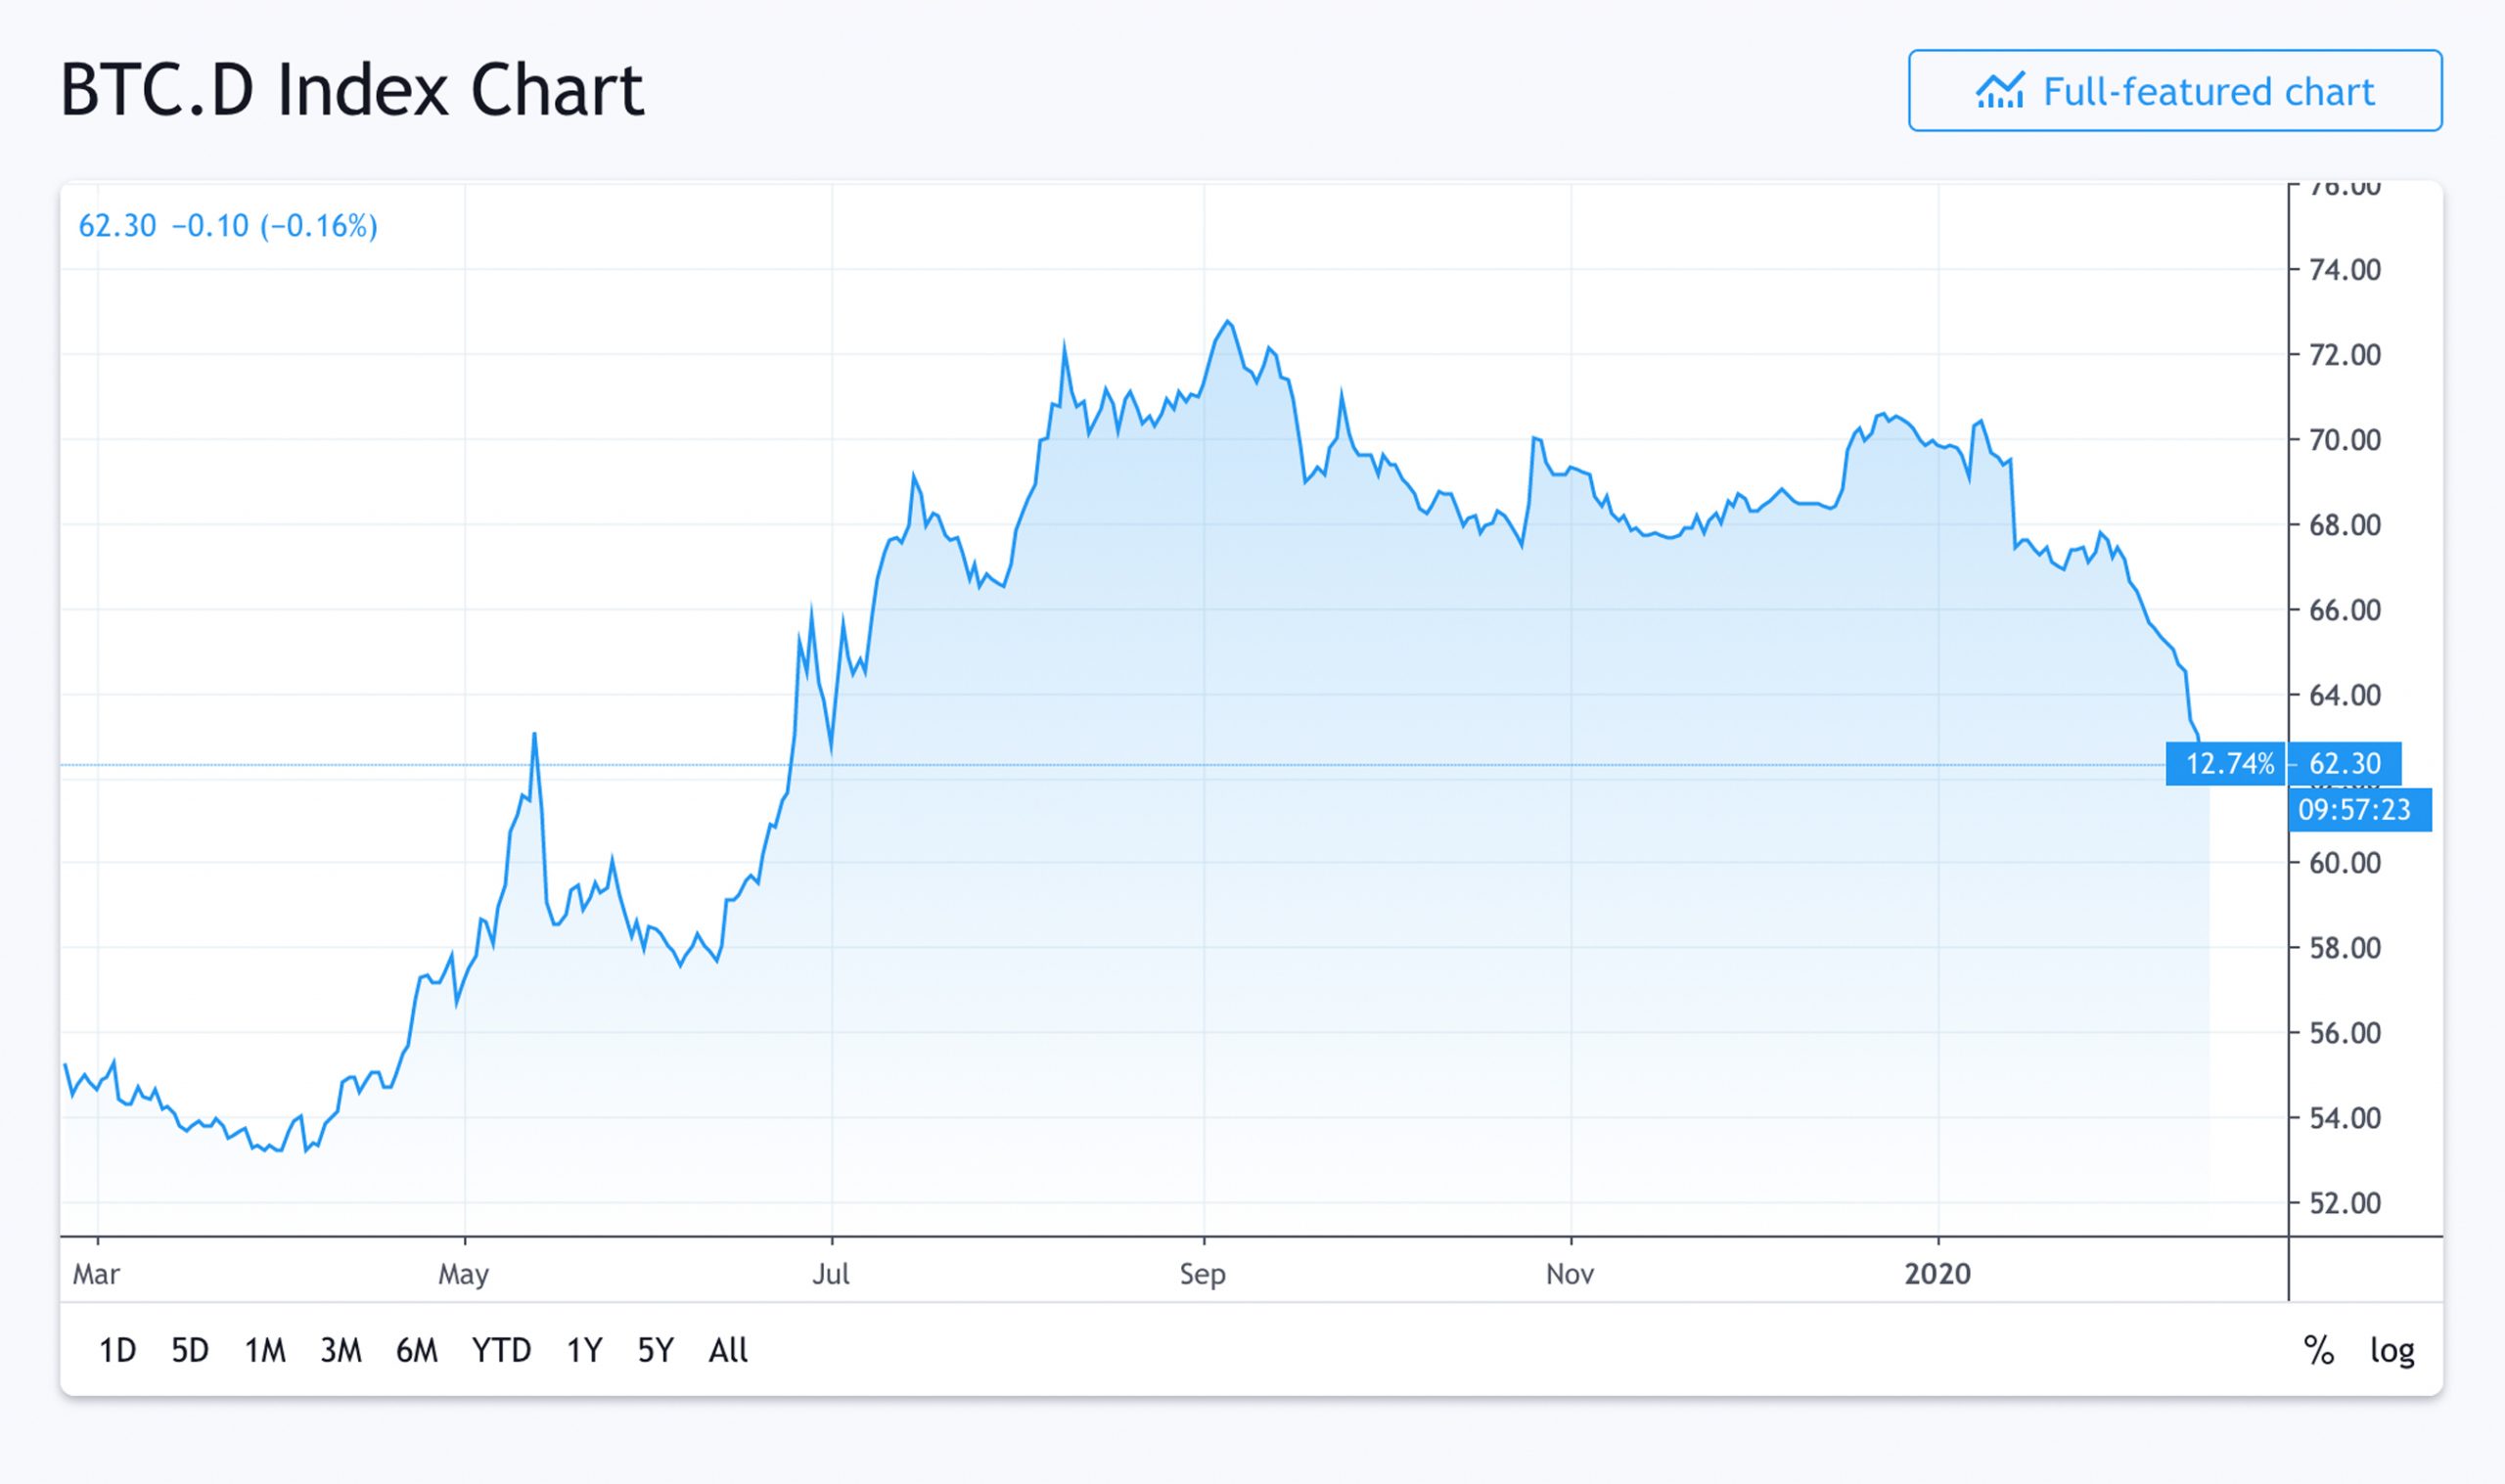
During the last few weeks, BTC dominance has dropped from a high of 70% to a low of 60%. The term and metric BTC dominance is the ratio of BTC’s market capitalization versus all the other coin market caps. So the current market valuation of the entire cryptoconomy is around $305 billion and BTC captures 61% of that today with a market valuation of around $186 billion. BTC has always been the world’s largest cryptocurrency by market capitalization and prior to February 2017, the asset captured more than 80% of the entire cryptoconomy for eight years straight. However, the video tweet below shared in 2018 shows how crypto dominance metrics can change drastically over time.
The evolution of the altcoin market share and BTC dominance #cryptocurrency#cryptosec#Crypto#cryptotwitter#altcoins#cryptotrader#cryptotrading#blockchain#btc#eth#bch#eos#ltc#xrp#bitfinex#cryptoexchange#binance#bitmex#crypto#cryptocurrencynews#cryptotradingpic.twitter.com/1IcerX7BHC
— Cryptosec (@vivasatori) September 15, 2018
After February 26, 2017, BTC dominance slid from 85% to a low of 40% one month later. At the same time, Ethereum (ETH) spiked to an all-time high of 31% of the cryptoconomy’s overall valuation and XRP was at 17%. A number of people believe that BTC’s rising network fees and clogged backlog (mempool) of transactions in 2017 and 2018 attributed to the decline. Alongside this, many crypto proponents and traders referred to the time as “alt season,” in which a variety of alternative digital assets reduce BTC’s share of the entire coin market cap.

After BTC dropped to a low of 40%, the dominance metric slid even lower in January 2018 as BTC dominance was around 33%. Since then, the digital currency has regained a lot of market cap dominance and BTC had risen to close to 70% on September 8, 2019. However, after the jump to 70%, BTC’s share of the cryptoconomy has been sliding once again. From September’s high of 70%, BTC dominance has dropped down to 60% on February 15, 2020, losing roughly 10%. The sliding metric has been due to other digital assets that have done far better percentage-wise as far as gains are concerned. For instance, during the last 90 days, BTC has gained 19%, but ETH jumped 52%, XRP 26%, BCH 82%, and BSV rose by 185% in that time period. BTC dominance has slid consecutively for the last 14 days straight to its current low and only today has it started to rise again slightly. It’s been one of the longest downward slides for BTC dominance since September 2018.

Are Market Valuations and Dominance Important Metrics?
Even though BTC dominance is a metric used by crypto market price aggregation websites, many proponents do not believe the data reflects any real value. Market caps only reflect the current worth of every coin circulating in real-time and some people think the data can be skewed. Despite the fact that a number of crypto proponents believe market caps and dominance are inadequate value metrics and do not necessarily reflect the project’s real worth, these metrics are used by the majority of crypto enthusiasts. In the early days, after assets like namecoin, ripple, litecoin, and mastercoin appeared, the website coinmarketcap.com was developed and the public were able to compare coins based on market valuations. There’s now a great variety of coin market cap aggregation websites that show similar data and provide other statistics too like trade volumes.

Despite some believing that market cap lists are not a good reflection of real value, individuals find the data very important. As mentioned above, investors believe there are significant reasons for BTC dominance declines, whether it was the network stress or alt season that prompted the decline from 85% to 33%. Market caps and dominance metrics show investors the level of risk involved as small-caps, mid-caps, and large-caps see different types of movements.

Traditionally, mid to small market caps are far more volatile than larger-cap cryptocurrencies and they can spike in price and drop in value very quickly. People view market valuation and dominance as a reliability metric because large caps usually present less risk to investors. Smaller crypto market caps provide investors with high-risk trading situations which can be good or bad depending on how the individual is trading.
The fact that BTC lost 61% of the dominance it commanded over the entire cryptoconomy between February 2017 and January 2018 is a metric of great importance to a lot of crypto enthusiasts. When BTC’s dominance climbed from 33% back to 70%, some maximalists and hardcore BTC supporters said that “altcoins were dying.” Although ever since this, altcoin values have been outperforming BTC by a long shot. Lesser known coins are also outpacing many coins in the top 20. BCH and ETH’s rise during the last 90 days did outperform BTC, but coins like presearch (PRE 2,641%), cryptaur (CPT 1,351%), htmlcoin (HTML 333%), vetri (VLD 322%), and Digixdao (DGD 308%) did even better.
Where do you see the cryptocurrency markets heading from here? Let us know what you think about this subject in the comments section below.
Disclaimer: Price articles and market updates are intended for informational purposes only and should not be considered as trading advice. Neither Bitcoin.com nor the author is responsible for any losses or gains, as the ultimate decision to conduct a trade is made by the reader. Always remember that only those in possession of the private keys are in control of the “money.” Cryptocurrency prices referenced in this article were recorded on February 15, 2020, at 9:30 a.m. ET.
Images via Shutterstock, Trading View, Bitcoin.com Markets, Twitter, coinmarketcap.com, Fair Use, Pixabay, and Wiki Commons.
Want to create your own secure cold storage paper wallet? Check our tools section. You can also enjoy the easiest way to buy Bitcoin online with us. Download your free Bitcoin wallet and head to our Purchase Bitcoin page where you can buy BCH and BTC securely.
The post BTC’s Market Share Drops Consecutively for 14 Days – Dominance Ratio Slides to 60% appeared first on Bitcoin News.