Creating Interactive Maps in WordPress with MapSVG
Publikováno: 29.5.2019
The MapSVG plugin for WordPress allows you to create feature-rich, interactive maps quickly and through a smart admin UI. Interactive maps are a common request for projects when you need to visualize impact over particular locations. If you are already on WordPress, this comprehensive plugin could be your solution for production-ready maps.
Think about the last time you implemented or scoped an interactive map. You may wind up estimating a significant amount of time for mapping your data from … Read article
The post Creating Interactive Maps in WordPress with MapSVG appeared first on CSS-Tricks.
The MapSVG plugin for WordPress allows you to create feature-rich, interactive maps quickly and through a smart admin UI. Interactive maps are a common request for projects when you need to visualize impact over particular locations. If you are already on WordPress, this comprehensive plugin could be your solution for production-ready maps.
Think about the last time you implemented or scoped an interactive map. You may wind up estimating a significant amount of time for mapping your data from its original source into JSON to be hooked to a visualization framework, like D3. Then comes configuring how users interact with the map itself. These are already significant development lifts.
Next comes the question of how you will manage your map data. Did it live in an external file? Require regular API calls to fetch data? It would be a lot easier to manage this data directly within your site’s WordPress admin as you would all other site content. No need to open up a code editor and maintain the map separately!
These and many other common map functionalities come baked into the MapSVG plugin for you to create multiple unique maps to fit your visualization needs. We’re going to dig into the plugin a little bit and use it to build an interactive SVG-based map in WordPress
Options for creating new maps
Once installed, MapSVG gives you five options for creating a new map based on vector, image, or Google Maps features. For the sake of this article, I will be focusing on the SVG features.

Within that New SVG map option are nearly 200 geo-calibrated and un-calibrated vector maps of countries and regions. The free version of this plugin, MapSVG Lite, lets site administrators create interactive maps with tooltips, customizable detail views, and markers placed by latitude/longitude coordinates. Upgrading to the paid version ($46) provides support for: map directory, integrated search, location filters, a detailed view of a map region, integrations with WordPress posts and Advanced Custom Fields, custom tooltips, and choropleth maps, among other premium features.
Creating a new map
Right, so we’ve chosen to create a new SVG-based map. Select one of the options from the dropdown to create a vector map. Whenever possible, choose geo-calibrated maps over ones that are un-calibrated. Geo-calibrated maps are newer and have region titles. Plus, they allow you to add map markers by geo-coordinates (i.e. latitude and longitude), or by entering an address that automatically converts to coordinates.
If using your own custom SVG file, select the Upload SVG option. Once uploaded, your custom file will be available in the New SVG Map dropdown under user-uploads/your-file-name.svg. There are a few additional steps I recommend to optimize your file prior to uploading it to the plugin's map:
- Regions that contain multiple vector paths (e.g. Hawaii), need to be grouped as a compound path in Illustrator. In Illustrator, this can be done by selecting the relevant paths, then going to Object >Compound Path >Make (or CMD + 8).
- Ensure your layers have clear, unique names. The layer name will be used as the region
{{id}}for templating and organizational purposes. - Next, open your SVG file in a text editor and give each path a title attribute. This will be used as the region
{{title}}in the templates.
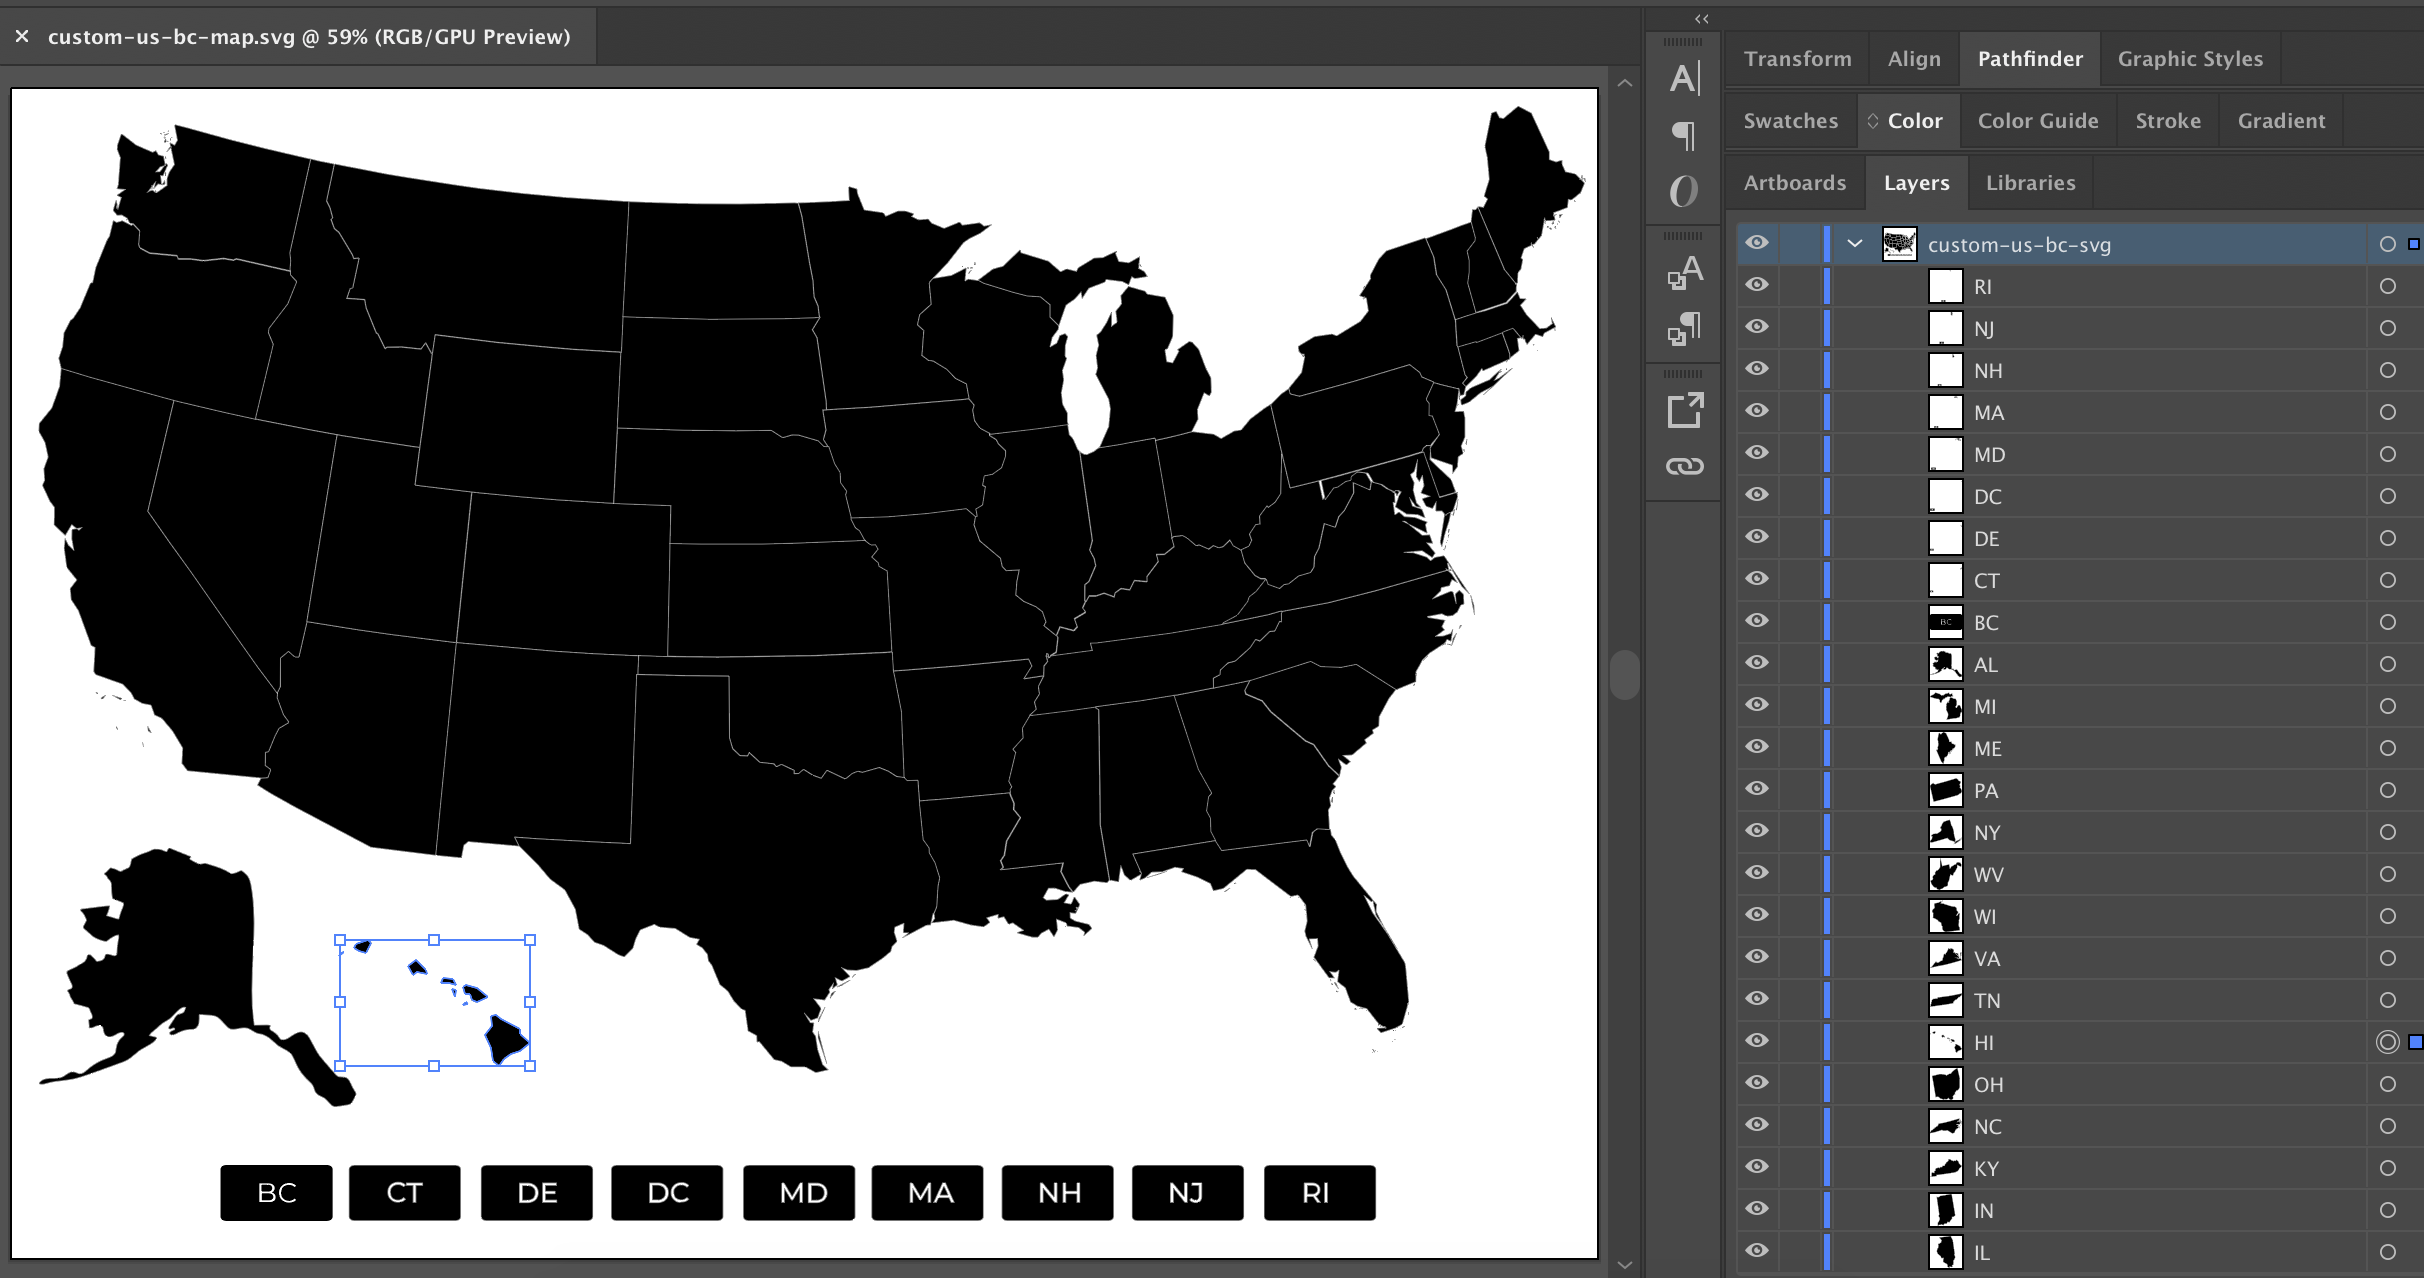
The id and title fields are default attributes pulled from the file to associate them with the individual paths. As of the latest release (currently 5.3.7) of the plugin, you can edit the SVG file directly in the WordPress admin to set the id and title values of each path, along with adjusting the path definition and drawing new paths. I personally prefer the control of editing in Illustrator and a code editor, but this is a nice option to have available to you.
Let’s proceed by creating a demo using the geo-calibrated maps provided by the plugin and using entries from https://confs.tech to visualize (some of) this year’s tech conference data from around the world.
Styling the map
Now that we’ve got our SVG file all set up and selected for use, the plugin interface opens to the settings panel. This is where we set the map name, define sizing dimensions, and enable tooltips, among other primary settings.
Alongside the settings tab, you will see tabs for controlling and setting specific map features. Switching over to the next tab, Colors, is where we set the map theme.
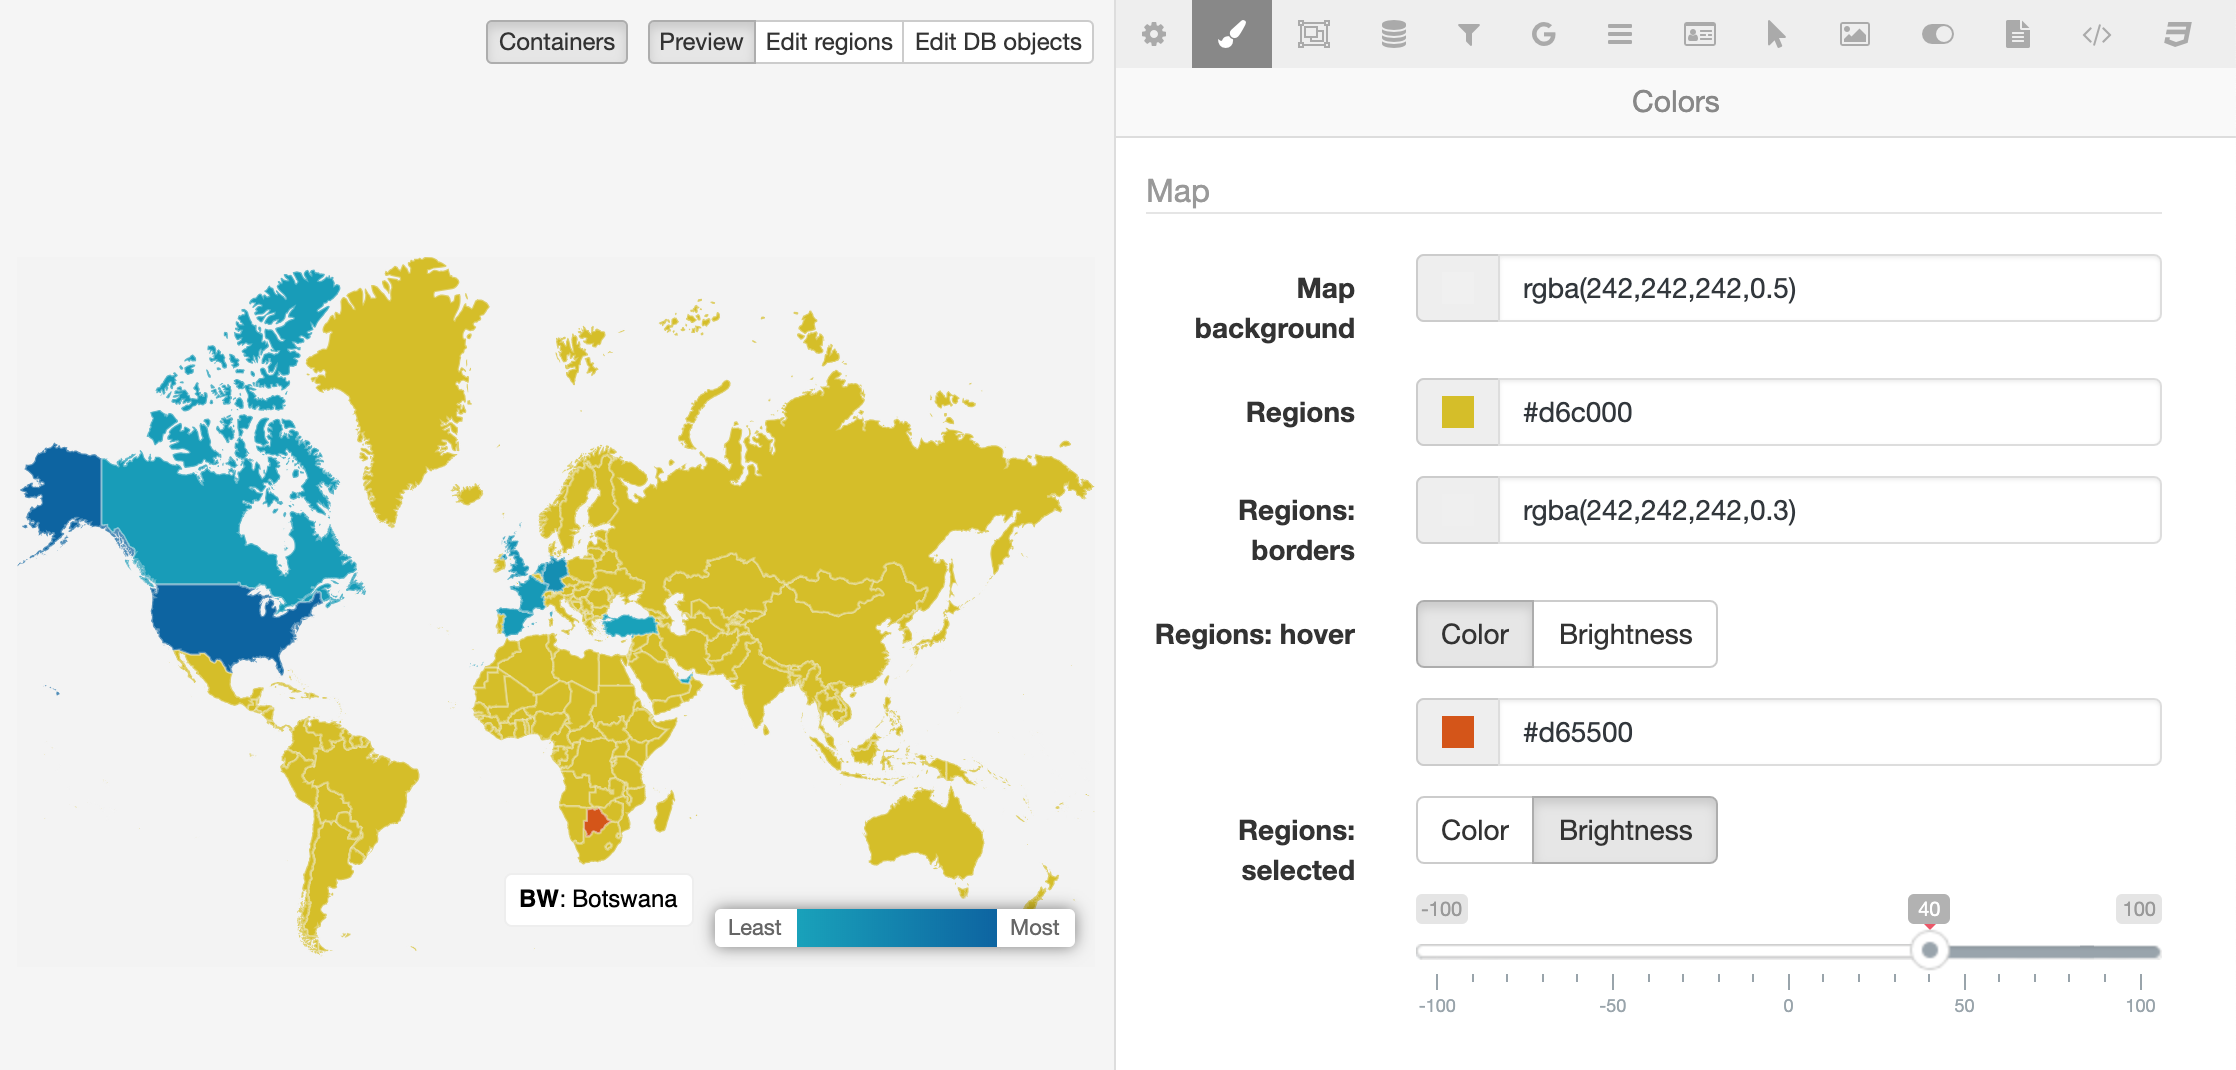
As you can see above, we can control the fill and stroke values of the map and the various active states of each path. A benefit of using a vector based map! For that reason, I prefer to leave the fill and stroke values undefined in Illustrator if I’m creating a custom map file. Stroke width, however, cannot be efficiently adjusted within the UI (because it would requires editing the SVG and changing the value for every single path), so it is best to set it in Illustrator and re-upload the file.
Further down are color options for the containers (e.g. directory, filters, sidebars, etc.) as well as the minimum and max colors values for a choropleth map (more on this later!). Container styles can also be set globally either in your theme’s stylesheet or in the setting's CSS tab.
Setting up map data
By default, the Regions tab will be pre-populated by regions based on the paths of the selected SVG, displaying their id and title values. You can edit and create your own region’s fields as needed. The same applies for the Database tab — where you enter your map data and associate it with the regions of the map.
For both region and database entries, you have the option of manually creating the fields and content in the UI or upload the data from a CSV file.
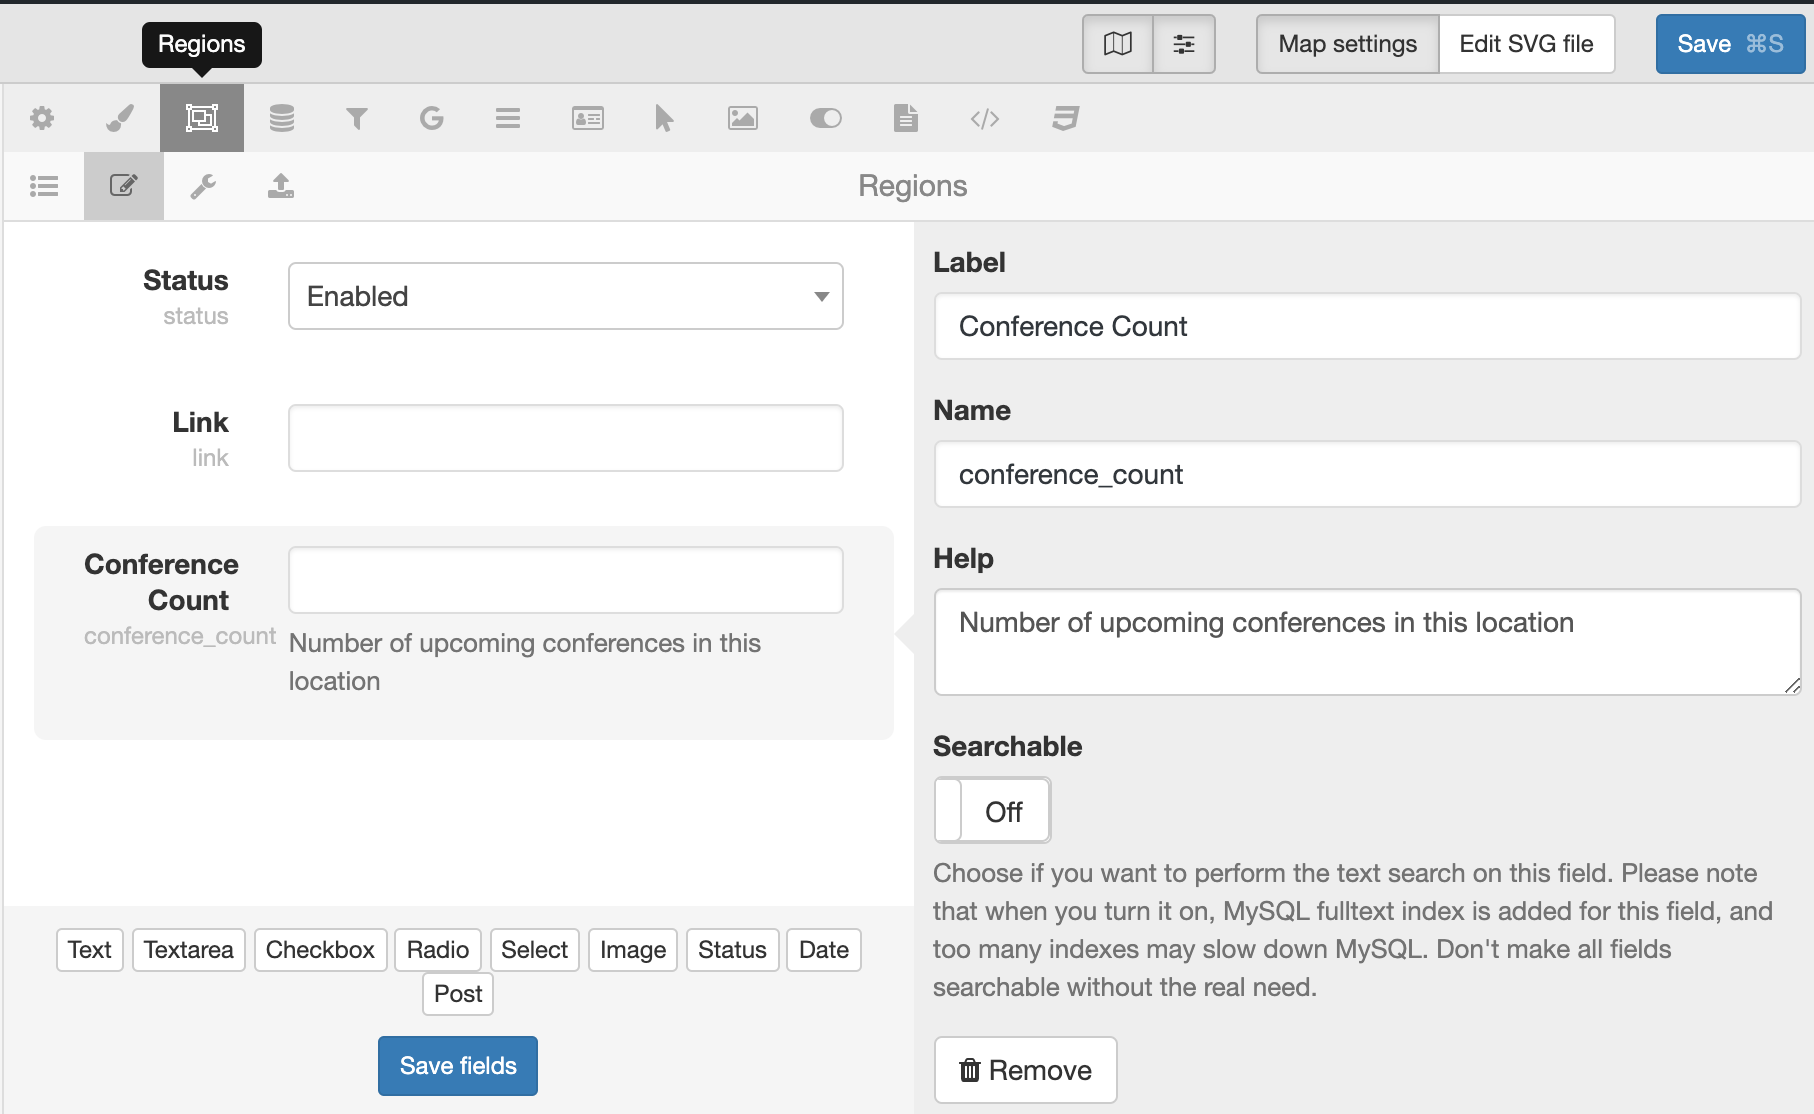
conference_count custom field will be used for the choropleth feature to create a thematic map of countries that have technical conferences this year, from least to most.
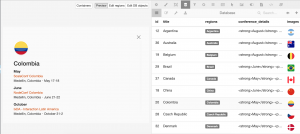
Notice the final dataset in the screenshot above, specifically the custom Regions fields for conference_details, conference details, and a field to upload images that display the flag of each country in the database. We can take this a step further by separating the content from the map itself and pulling it in as post data of any WordPress post type. That’s where Advanced Custom Fields can help to create fields for that data in the post editor and creating a relationship between the submitted data to populate the values in the map. Not required, of course, but it’s nice to have this option for the sake of separation of concerns.
Displaying map data
When showing information about a region or database object on a map, we have to set up a template in the plugin. There are five types of templates: popovers, tooltips, detail view, directory, and labels.
Templates accept plain text, HTML, and Handlebar markup to display region and database variable values. If pulling in post data via the Post database field, you will have access to the standard WordPress fields, post.id, post.post_title, post.post_content, post.url, along with any custom fields created with Advanced Custom Fields with this syntax: post.acf.my_field_name. Whenever you need to render a rich text field such as withpost.post_content, you have to use Handlebars' {{{triple-stash}}} syntax to output the rendered HTML.
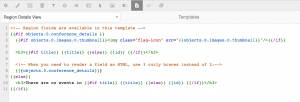
The use of Handlebar syntax also means we can build conditional logic into the templates to create dynamic template views based on region and database values. In MapSVG 5.0 and up, the template options come pre-populated with HTML comments and starter markup for the default region and database fields. Super helpful!
Adding a map to a page
MapSVG includes a shortcode used to embed a map on any page or post. Drop a Gutenberg shortcode block on the page and call MapSVG with the ID of the map to embed: [mapsvg id="418"].

For those working in the classic WordPress editor or with a plugin version that predates 5.0, a map icon will be added to the TinyMCE toolbar, which will inject the shortcode to your post content that takes the map ID. The map ID can be found in the MapSVG editor dashboard or in the top breadcrumbs of the active map. A handy Copy to clipboard button is included next to both instances shortcode to grab it for use in the post editor.
Demo
With data entry complete and a few toggles of additional MapSVG settings, we have a fully functional interactive and responsive map! And notice just how little code we had to touch along the way.
Going beyond maps
The great thing about the SVG feature of the plugin is that, at it’s core, SVG can be whatever we want. You can create an interactive "map" from the vector paths of just about anything: a building floor plan, an infographic, or maybe an interactive timeline of your career? It’s more than just maps!
Not on WordPress? No problem. MapSVG also comes as a jQuery plugin that's equally worth trying for interactive maps outside of WordPress.
Resources
- MapSVG website (Includes live demo of the admin)
- MapSVG tutorials
- MapSVG documentation
- MapSVG Lite (WordPress Plugins Directory)
- MapSVG video tutorial archive (YouTube)
The post Creating Interactive Maps in WordPress with MapSVG appeared first on CSS-Tricks.