Call for data: (Steam) game revenue over time!
Publikováno: 27.10.2020
We need your game's (anonymized) data.
[The GameDiscoverCo game discovery newsletter is written by ‘how people find your game’ expert Simon Carless, and is a regular look at how people discover and buy video games in the 2020s.]

So we haven’t done a ‘call for anonymized data’ post recently on the GameDiscoverCo newsletter, but one subject has been coming up quite a bit recently. Sure, let’s say your game made $50k in its first week on Steam. But at the end of Year 1, will you have $100k or $250k? And how about at the end of Year 2 or Year 3?
I’d like to use all of your (anonymous and abstracted) data to try to get a good sense of if there are any trends on revenue scaling/’long tail’, or if they are changing over time. If you can help (submit data on one or multiple games!), please fill out this survey now.
We'll compile all the results publicly and publish them for free on the GameDiscoverCo newsletter and on Gamasutra, as we did for the ‘Steam sales to reviews ratio’ data and the 'Steam wishlists to first week sales' data.
So again, help us out by completing the short survey, tell your friends, and we’ll reflect the compiled data back your way. Please spread the word - we’ll leave it open until Friday, November 6th.
Bonus: results from previous GameDiscoverCo surveys!
Since many of you are new to the GameDiscoverCo newsletter, I thought it might be useful to recap the two public Steam surveys I’ve done so far.
Il’ll quickly go through the results, and whether I still trust the data in them:
‘Steam sales to reviews’ explained
Firstly, the ‘how many sales does a game have, looking at its Steam reviews?’ question. The results of this particular survey can be summarized in just one handy graph:
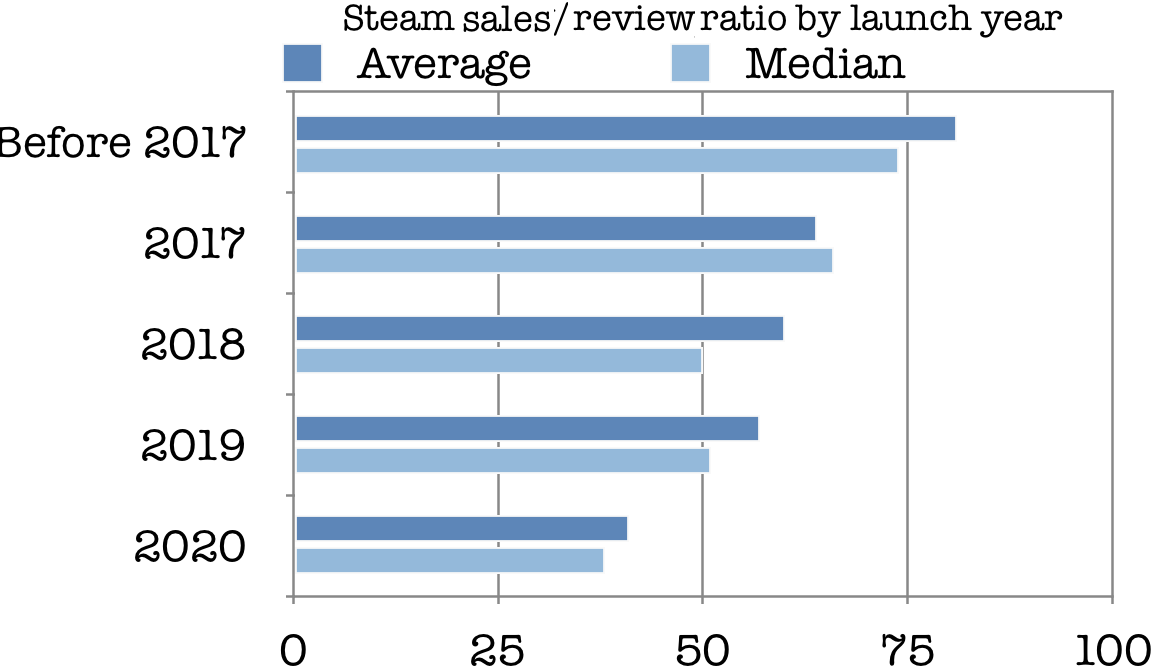
As I said back in August 2020: “If you launched your game in 2020, you have an average of 41 sales per review and a median of 38 sales per review. And it seems like the current non-outlier range is between 20 and 60 sales per review - for a game launching from scratch this year.”
So a game with 1,000 Steam reviews released in 2020 might have sold anywhere between 20,000 and 60,000 copies. (The actual gross/net revenue depends on things like average sales price and discounting, so we’re not going into that here!)
Going back further in time, as you can see, the ratio increases. This is partly because of the ‘would you like to review this?’ Steam prompt that turned up at the end of October 2019. But that same button has meant older games people still play regularly have been reviewed a lot more, which can also skew things.
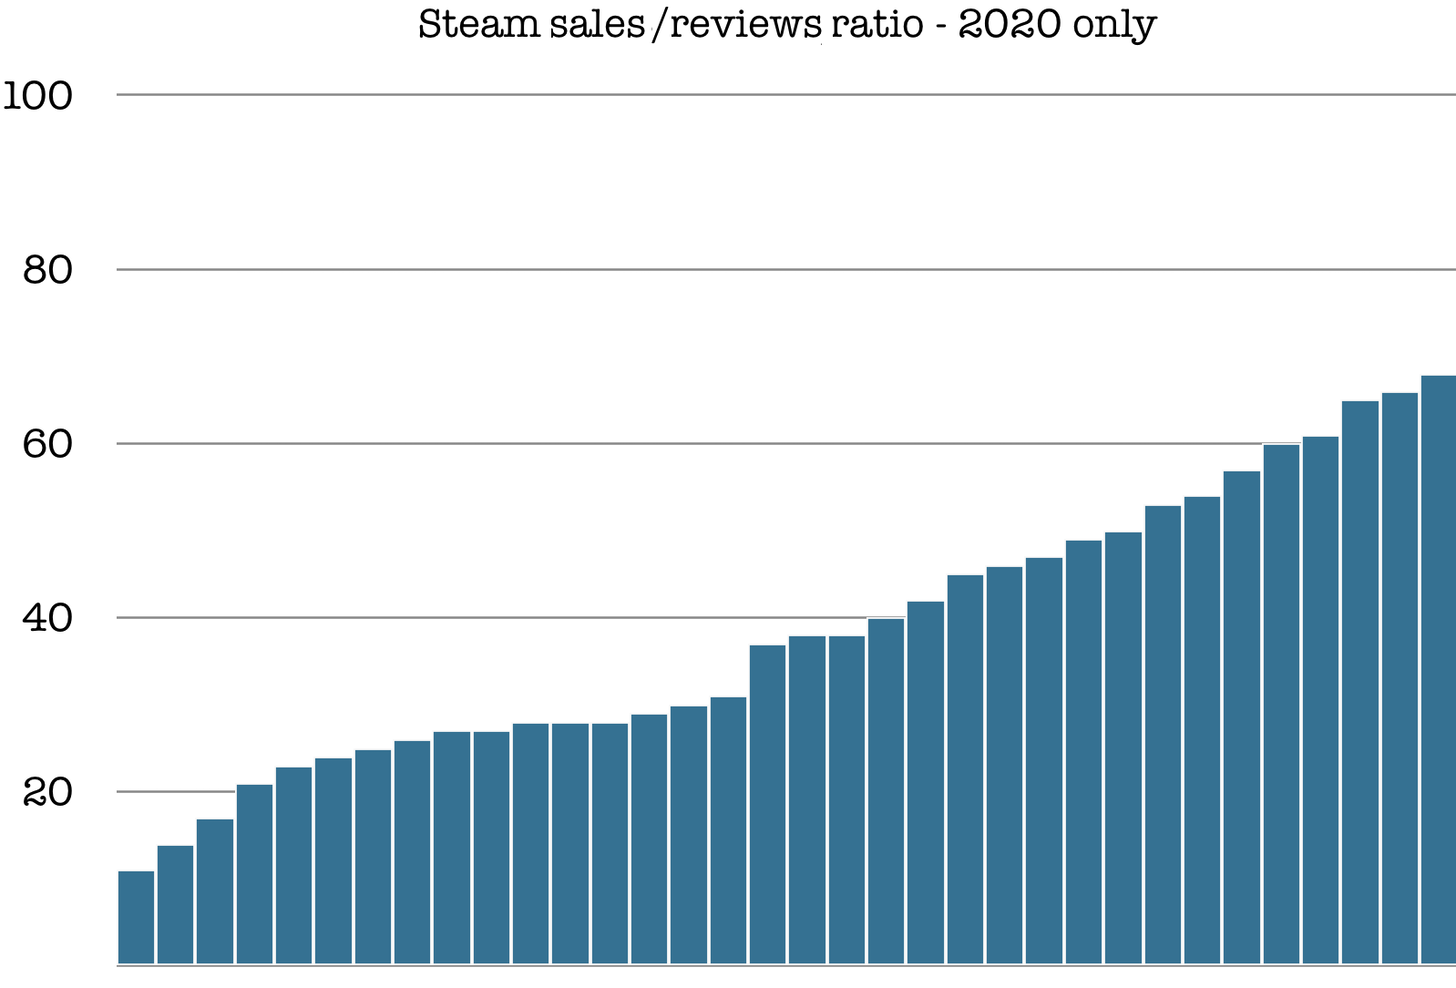
Anyhow, here’s the 2020 sales/review ratio for all respondents so you can see it’s nicely spread out:
I still feel good that - within a larger range (for example, 20x to 60x for 2020 reviews), this survey is fairly accurate. I’ve heard of larger studios starting to use it in planning, and SteamDB integrated a version of it onto each game’s detail page (However, SteamDB ended up using just the 2020 estimate for all game pages.)
So I would give this survey an A- for accuracy, as long as you use a range and the correct years when expressing the possible outcomes!
Steam wishlists to first week sales, explained!
In this survey, completed in June 2020, we asked people how their wishlist totals compared to first week sales numbers. (Total sales numbers would include both wishlist conversions and organic purchases during that week.)
The responses were extremely varied and produced the following across all ages/wishlist sizes. (So in the below graph results, 1 could be ‘1000 wishlists at launch, 1000 sales in first week’ and 0.1 could be ‘1000 wishlists at launch, 100 sales in first week’):
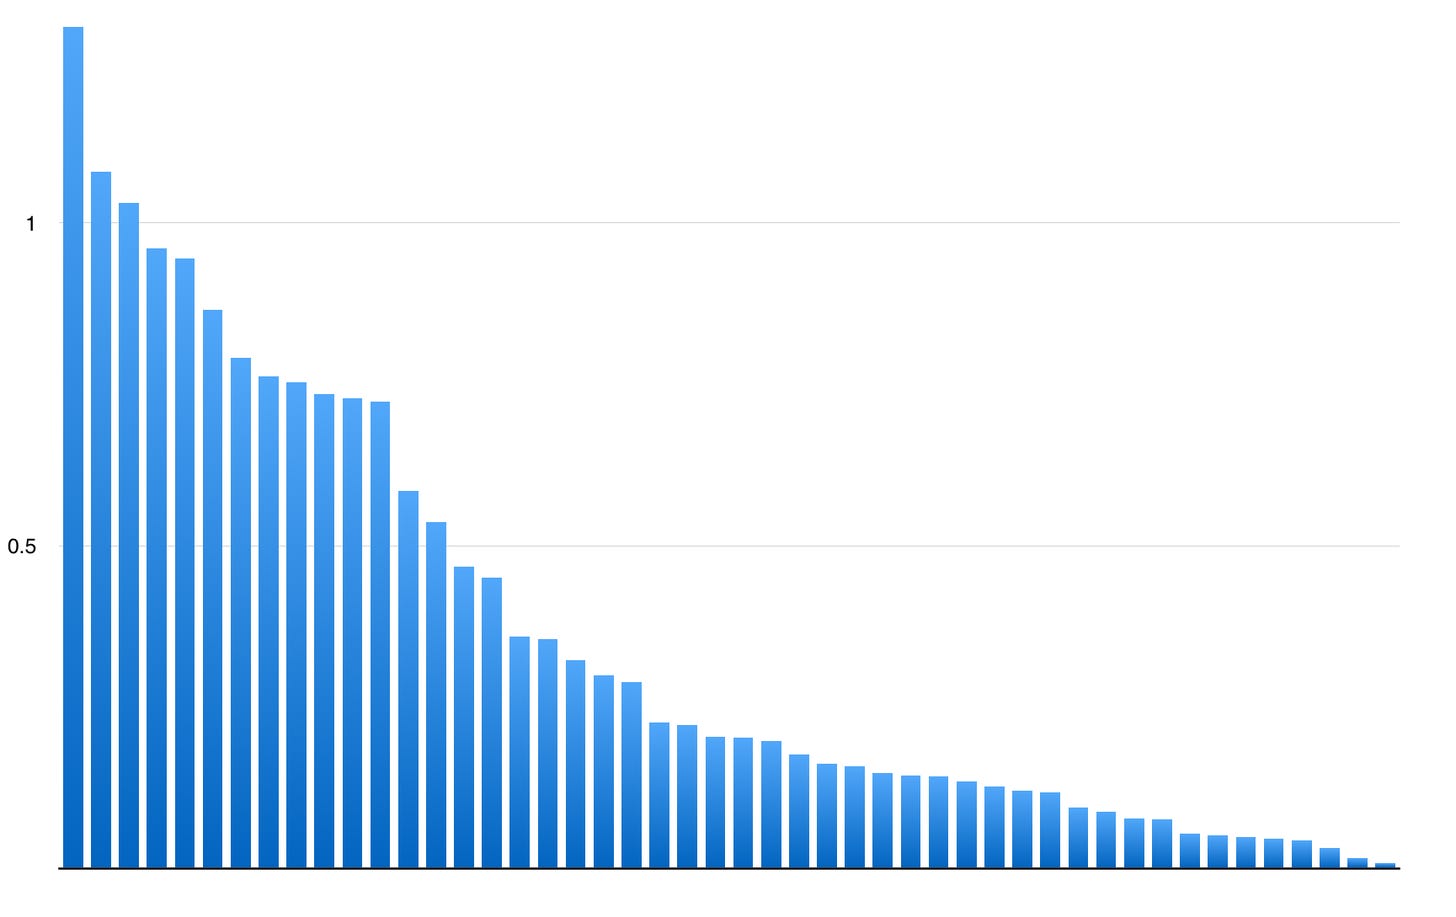
As I explained at the time: “For all of these games (of varying ages, some Early Access, some full release), you get an average of 0.36 sales per wishlist, and a median of 0.2 sales per wishlist for your first week on Steam. But with some wiiiide ranges, as you can see from the graph.”
And if you split by number of wishlists, you see similar volatility in eventual results. This is the reason why Steam are recently saying there’s no particular number you should ‘predict’. For example, here are the wishlist/sales ratios for all games that launched with more than 10,000 wishlists:
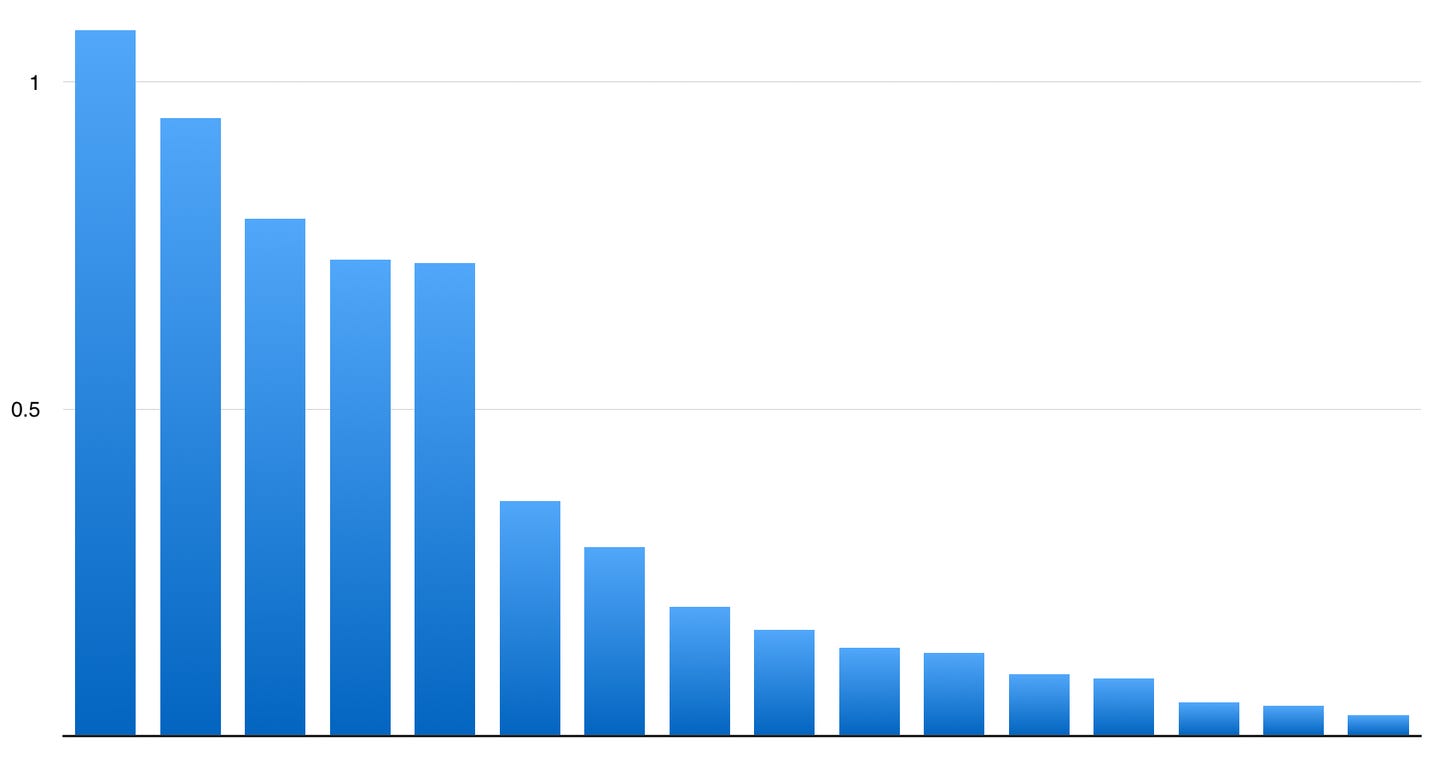
So really, that could be anywhere between 0.75 down to… 0.05, if you take the majority of the data points? That’s so much of a wider range than the Steam ‘sales to reviews’ data, which only varied by a factor of three-fold.
In addition, I noted at that time: “One thing that did decline somewhat is wishlist conversion rate for the two years we have the most significant survey responses, though: 10% in 2019, 7.3% in 2020.”
I’m hearing more and more about devs having disappointing launches compared to the number of Steam wishlists they built up, particularly when they added them via demos and pre-release Steam features. So I think a re-assessment is in order here - although this data gives you a clear ceiling and floor.
Therefore, I would rate this data more like B- in relevance/accuracy to today’s dev launching a Steam game. And I’m planning to conduct an extra follow-up survey before the end of the year to anyone who launched a game in 2020, asking for more detail.
And that’s it! For now, fill out the ‘first week/first year’ sales survey, and look for more newsletters later in the week - take care.
[This newsletter is handcrafted by GameDiscoverCo, a new agency based around one simple issue: how do players find, buy and enjoy your premium PC or console game? We’ll be launching a ‘Plus’ paid newsletter tier with lots of extra info/data - watch out for it soon.]