Data deep dive: what's the 'long tail' like for Steam games?
Publikováno: 16.11.2020
We have survey results for you.
[The GameDiscoverCo game discovery newsletter is written by ‘how people find your game’ expert & GameDiscoverCo founder Simon Carless, and is a regular look at how people discover and buy video games in the 2020s.]

As you may recall, we did a call for data a couple of weeks back, because one subject has been coming up quite a bit recently. And as I said at that time: “Sure, let’s say your game made $50k in its first week on Steam. But at the end of Year 1, will you have $100k or $250k? And how about at the end of Year 2 or Year 3?”
So we asked for your (anonymous and abstracted) data to try to get a good sense of if there are any trends on revenue scaling/’long tail’, and I’m delighted to say that almost 100 of you stepped up to provide information. Thank you so much! So let’s see what we found out…
How Month 1, Year 1 Steam $ compares to Week 1?
So we asked about the gross revenue you all made on Steam in Week 1, and then asked ‘what multiple of that revenue did you have at the end of Month 1? How about Year 1?’ And got the following results:

So as you can see, the average multiples were 1.57x for Month 1 to Week 1, and 4.52x for Year 1 to Week 1. But the average is skewed by a few titles who launched with a small amount of revenue, and so blew their multiples out of the water, haha.
So we think the median (the 50th percentile result) is a better comparison than average. And that comes out to 1.47x your game’s revenue for Month 1 compared to Week 1, and precisely 4x revenue for Year 1 compared to Week 1. Thus, for a median game that launched with $50,000 in gross revenue, you’d have $73,500 at the end of Month 1 and $200,000 at the end of the first year.
(Two important caveats. Firstly, we didn’t talk about units sold, just gross revenue. So presumably you’re putting your game in all the big Steam sales with discounts to get to those numbers. And so units sold are more than 4x. Secondly, we excluded Early Access games from this chart, because EA games moving into full release can really spike multiples.)
Getting deeper into ‘long tail’ data points?
Something we’ve done with previous surveys is to also show all of the relevant data points that we plotted, just so you can understand the shape of the possible outcomes.
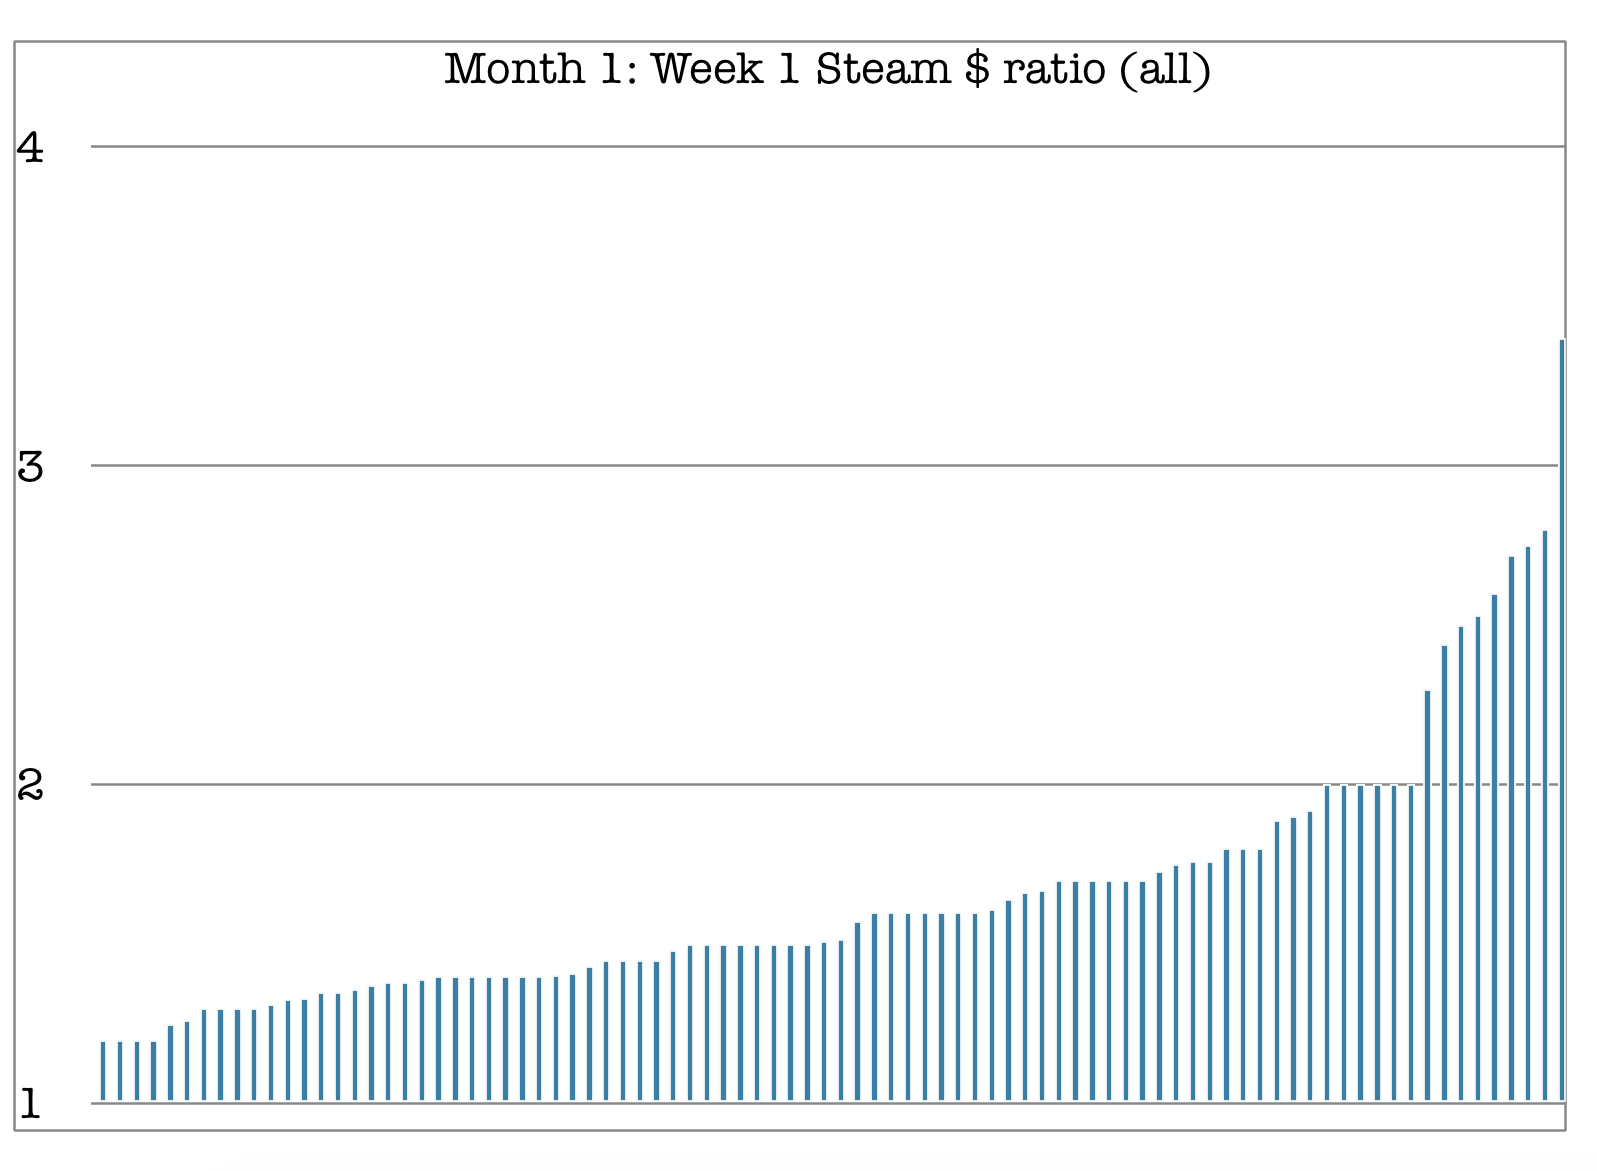
So here’s all of the Month 1: Week 1 Steam multiples, including Early Access in this case (because we’re presuming nobody launches out of EA in the first 30 days!) You can see a pretty large range here, but the vast majority of outcomes are between 1.2x and 2x:
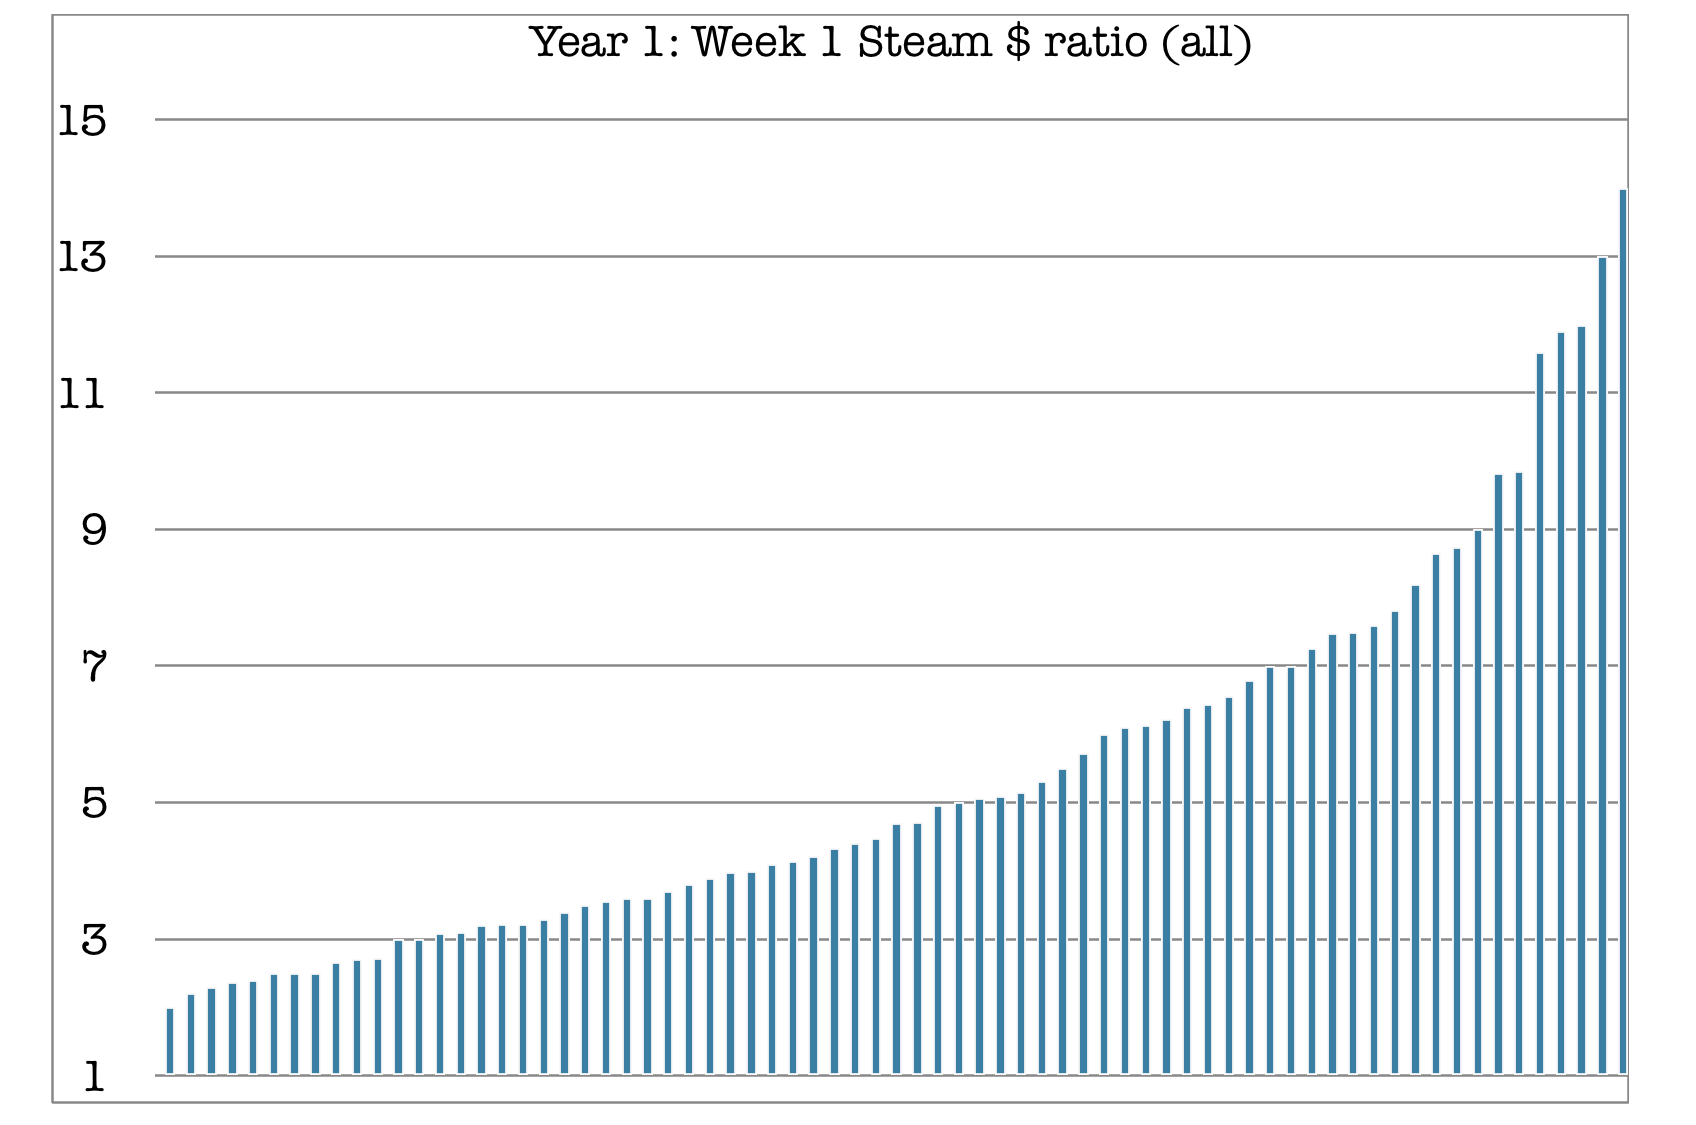
Next, let’s take a look at all the data points - including Early Access games - for the Year 1: Week 1 revenue multiples. There’s some pretty outlandish multiples in here. But many of them are because a full Steam launch gets you extra Steam featuring (and an Early Access launch gets you - relatively speaking - less.) Nonetheless, check it out:
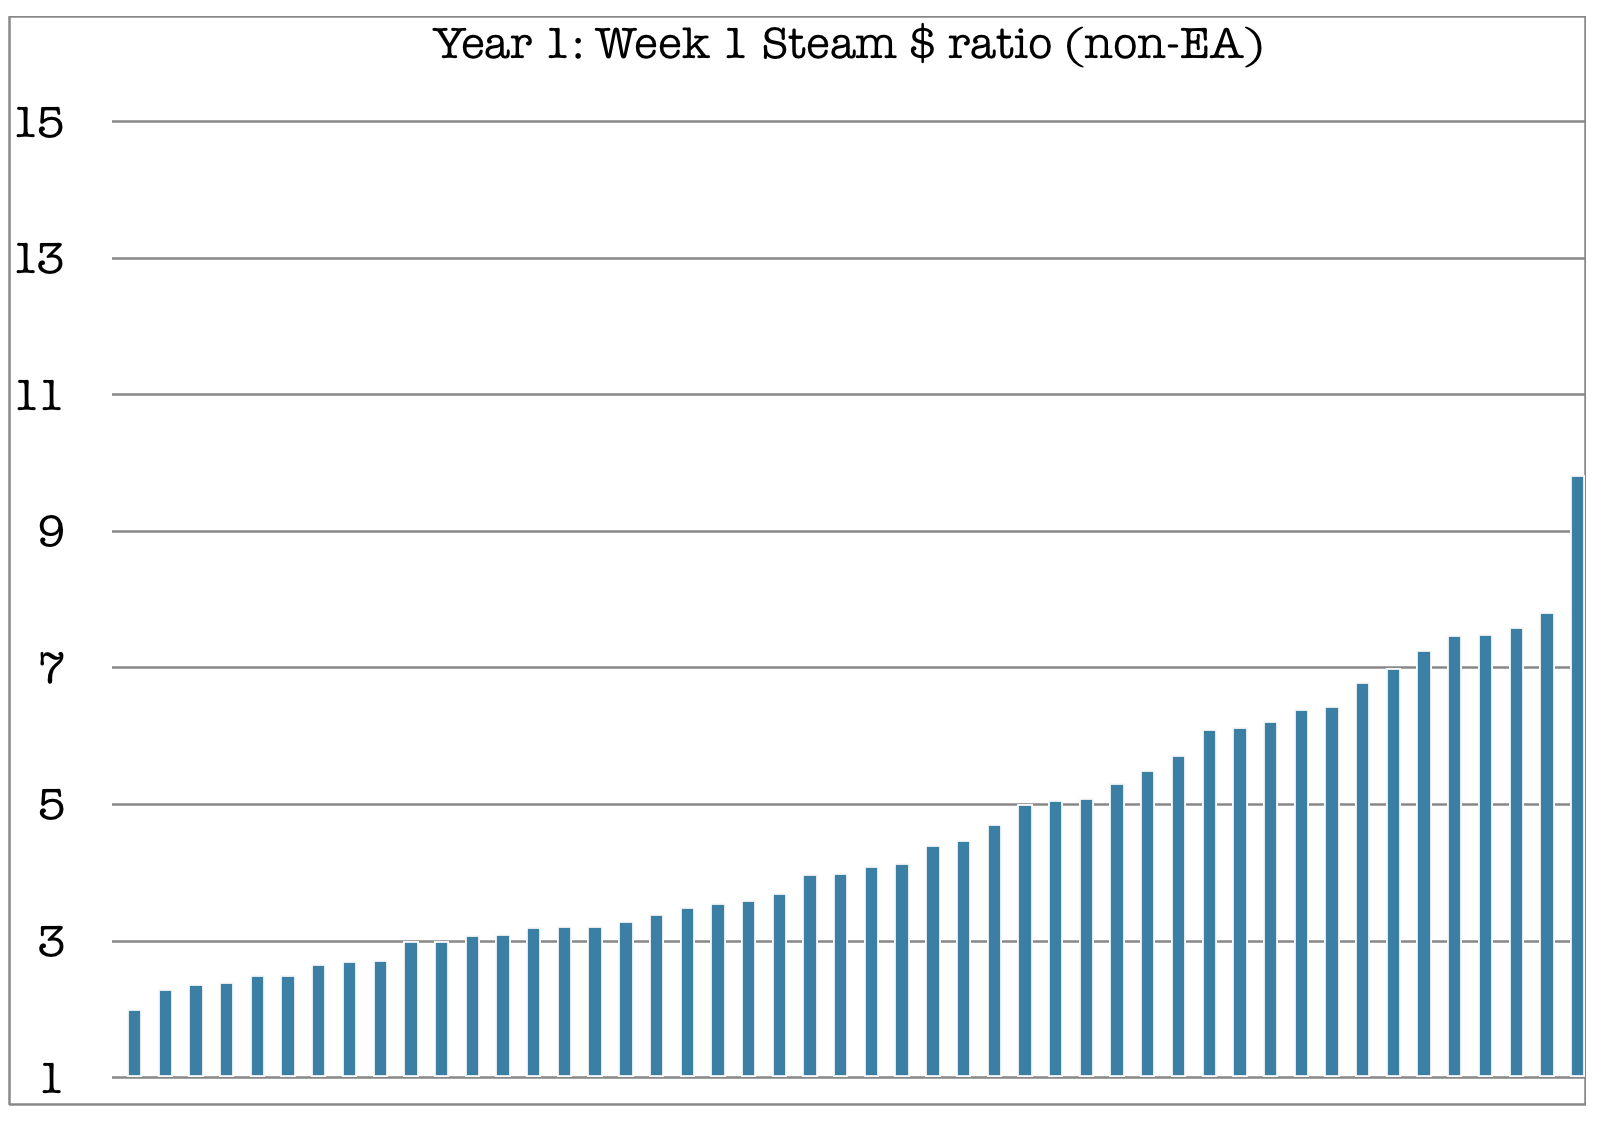
So if you’re not launching in Early Access, the points plotted seem a little more conservative and sensible compared to what we’ve heard anecdotally. The wisdom was generally that an ‘OK’ Year 1 is 2.5-3x your first week, revenue-wise, and 5-6x is doing really well. And indeed, the data shows this:
Before we carry on, one vital thing to discuss. This data was from all eras on Steam - from 2015, from 2017, from 2019, from 2020, even (for the one month data!) So perhaps things have been changing massively, and so we should take this all with a grain of salt?
Well, at least with the data we have, year of launch doesn’t change the multiples that much. It’s true that more and more games are launching on Steam, and we do believe the first week average/median sales for all Steam games is decreasing. But after you launch, the Month 1/Year 1 multiples are similar, no matter when you debuted on Steam. Look, here’s proof:

The only addition we’d make is that the ‘1 week to 1 year’ multiplier for games launching in 2019 with >$50k revenue in first week was 3.26x - and the ‘1 week to 1 month’ multiplier was 1.39x. We feel like those might be more realistic numbers to expect for larger games launching on Steam in the recent past.
The ‘long long tail’ - Year 2 and beyond
Finally, we suspect our longer-term results are somewhat affected by survivorship bias. (If your game isn’t selling a couple of years after release, you may not be responding to calls for data about it!)
But nonetheless, we wanted to show you the numbers we received for ‘1 week to 2 years’, as well as 3 years, 4 years, and 5 years - all split by ‘all games’ and ‘non-Early Access games only’:
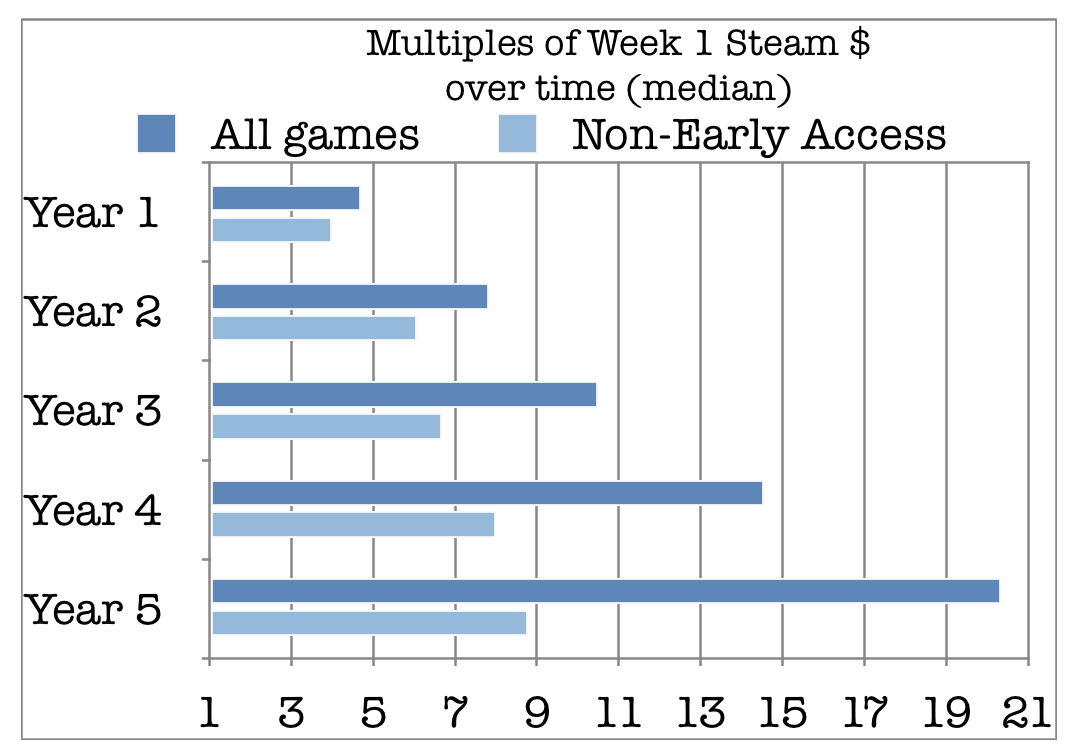
So just to put the gross revenue multipliers out there in text too, it’s, for non-Early Access games: 4x (Year 1 multiplier); 6.06x (Year 2 multiplier); 6.69x (Year 3 multiplier); 8x (Year 4 multiplier); 8.77x (Year 5 multiplier).
And then for all games, bearing in mind that slow start for Early Access (and perhaps that EA games are longer lived when they do SaaS-style updates?) 4.7x (Year 1 multiplier); 7.82x (Year 2 multiplier); 10.48x (Year 3 multiplier); 14.55x (Year 4 multiplier); 20.34x (Year 5 multiplier).
Conclusion
And there we have it. Use this data with the 'Steam wishlists to first week sales' data* and you can stitch together your own story about many unreleased or released games - yours and others. (*Incidentally, we’ll have an update on ‘Steam wishlists to sales’ soon, since we’ve got some new data about how to interpret that better.)
Of course, your trajectory isn’t your destiny. But surveys like this do show some things that you can and can’t do. So please be hopeful but realistic about the whole thing. The video game business is big, crowded, and complex, but there’s nowhere else we’d rather be.
[This newsletter is handcrafted by GameDiscoverCo, a new agency based around one simple issue: how do players find, buy and enjoy your premium PC or console game. Contact us if you want help with your game or game portfolio’s discoverability quotient.]