Estimating Steam/console sales: two hot methods!
Publikováno: 11.8.2021
We're getting all spreadsheet-y on yr ass.
[The GameDiscoverCo game discovery newsletter is written by ‘how people find your game’ expert & GameDiscoverCo founder Simon Carless, and is a regular look at how people discover and buy video games in the 2020s.]
Time for the second free GameDiscoverCo newsletter of the week, and we’re excited about this one - which has been in development for some time. Launch and post-launch sales curve for your games can be a tricky beast.
And while we can’t predict perfectly, we can present new ways of approaching it! Plus a whole bunch of other active news from the game discovery landscape. Let’s do it.
[PSA: in addition to our ‘Complete Game Discovery Toolkit’ eBook for members, we have our active member Discord - which is fun AND informative - and many more perks if you upgrade to our GameDiscoverCo Plus newsletter tier- thanks to everyone who did it so far!]
Your game’s sales estimates: 2 hot spreadsheets

One of the things we get asked about a lot at GameDiscoverCo is: what financial expectations should I have for my game, based on how it’s pacing pre-launch or at launch? To which our answer is… every sale is like a blessed drop of water as you trudge through an endless desert, my son.
But more seriously, we can get very basic, ‘indicative’ ideas of how titles will do, pre-release or shortly post-release. How? We can combine pre-release info like Steam wishlists with post-release info like pricing, sales ratios, and ‘gross to net’ rates.
And while the following two spreadsheets will come with masses of disclaimers, they provide some important data to ballpark estimate possible returns on your game(s). A lot of the time, devs just have no idea what to expect. So here’s a starting point.
Method 1: GameDiscoverCo’s BASIC predictions

Look, GameDiscoverCo made a super simple Google spreadsheet for some of our regular clients, and is now sharing it with you all. Copy or save the spreadsheet to edit it. There are just two things you can change without editing formulas: the number of Steam wishlists at launch, and the average global price in USD of your game.
From there, the spreadsheet makes a bunch of extrapolations to work out: Week 1 Steam sales(as well as Day 1 Steam sales as a bonus); Week 1 Gross & Net Steam revenue (presuming you’re not in a country that has 30% tax withholding from the U.S.!); Year 1 console net revenue, Year 1 total net revenue, and then 3-year Steam revenue, 3-year console revenue and 3-year total net revenue.
So the example here: a game with 10,000 Steam wishlists on launch that converted its first week at 0.2 sales per wishlist (so 2,000 sales in its first week) would end up making a net of $222,290 across PC and console over 3 years. (Presuming you discount it, and all that good stuff.)
The biggest gotcha here by far is ‘Week 1 sales compared to launch wishlists’, as we constantly mention - our data says it can be as low as 0.03 and as high as 1 sales per wishlist. So tweak the formula for a variety of scenarios.
Also: this particular spreadsheet is a bit more conservative on Week 1: Year 1 revenue ratio (which we put as 3x) than our actual surveys. And console revenue vs. PC is just a total handwave. But if you want a super easy look at possibilities - here it is!
Method 2: Fellow Traveller’s SOPHISTICATED predictions
What’s that, you say? You want the Rolls Royce of prediction models, and not the spluttering old jalopy that GameDiscoverCo just tried to sell you? Fine, just fine.
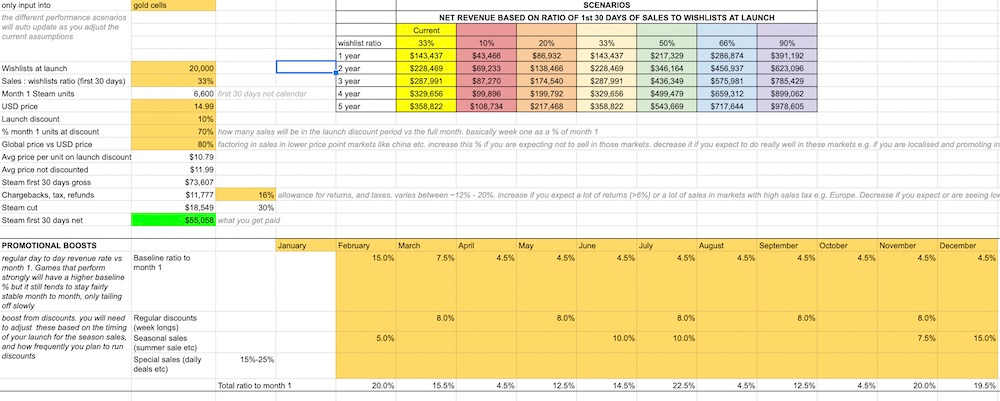
Well, good news - the wonderful folks at narrative game publisher Fellow Traveller are making freely available via the GameDiscoverCo newsletter its internal forecasting template (Google spreadsheet link, make a copy to edit) which it shares with all its developers. The publisher uses this model to “have some sort of month by month forecast both for our own budgeting and to give our developers an idea around monthly cashflow, when funding will be recouped, etc.”
The publishers of Paradise Killer, Genesis Noir & Neo Cab - who put out narrative game of a specific type, so “wouldn't want to imply that these numbers are gospel or industry standard” - have constructed a much more sophisticated version of the GameDiscoverCo spreadsheet. We’d particularly like to highlight the following:
All of the Fellow Traveller calculations are based on Month 1: Launch Wishlist numbers (not Week 1: Launch Wishlist, as we generally tend towards!) So don’t get confused, as we initially did.
The document specifically allows you to easily switch your game’s Month 1 Sales: launch wishlist ratio between multiple possibilities: everywhere from 10% (0.1) to 90% (0.9), and all of these options and many more are very possible! (Don’t count your chickens, etc.)
There’s some really nice bells and whistles built in, like: being able to enter the launch discount, tweaking the global average price vs. the USD price depending on your country mix, and so on.
What’s even nicer is: there’s some clever sales percentages built in to estimate the effect of being in a regular weeklong Steam discount vs. a ‘big’ seasonal sale like the Summer Sale vs. a spotlight sale like Daily Deal/Midweek Madness. They’re all listed as a percentage of month 1 revenue, and broadly based on real-world Fellow Traveller data.
What this document doesn’t show is PC revenue outside of Steam (you’ll have to input those percentages yourself), or console revenue (again, you’ll need to enter those percentages by hand. There’s a very rough estimation at Switch sales boost %s at lower discount rates.)
Why? It’s just that Fellow Traveller (and GameDiscoverCo) didn’t feel comfortable putting ‘typical’ console market share percentages there, because it can vary so radically. We’ve covered this a couple of times in the newsletter - here’s an example from late in 2020, if you want to peep some numbers.
Chris Wright at Fellow Traveller also wanted to add: “The model is most useful once you have real data from your launch, and then update [the spreadsheet] over time... Once you can see things like where your baseline is, what boosts you're getting from promotions and you start to schedule in your sales, it allows you to more accurately predict the tail.”
Anyhow, thanks again to Fellow Traveller for putting this out there. We do feel like this level of communication for publishers to pass on to devs really helps everyone understand what might happen revenue-wise, before and after recoup. (And individual devs can use something like this for revenue estimation, too.) Transparency is king!
Are there more games being released in 2021?
Had a brief Twitter DM conversion with Axios’ Stephen Totilo recently where he asked (in conjunction with an Axios article about how July was packed with interesting new games) what the empirical stats were for game debuts, year on year.
You can argue that, in the era of GaaS titles, there’s so many more actively developed games vying for attention, years after release. So ‘new releases’ is perhaps no longer the best metric. But it’s still a really good one. So this is what I swiftly dug up, and am passing along:
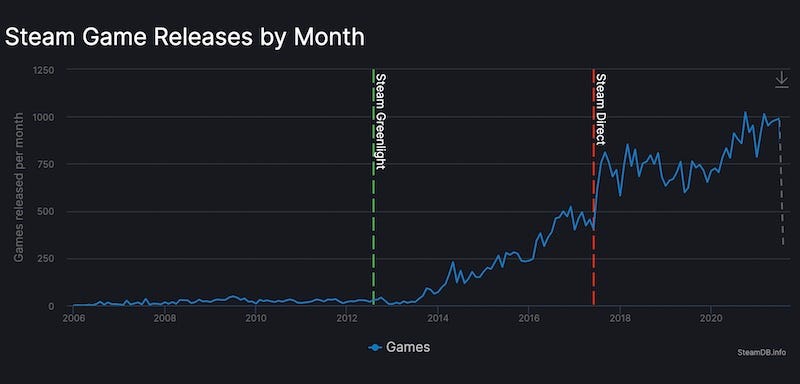
On Steam, we have this handy monthly releases chart from SteamDB, which shows that some months are edging over 1,000 games released on Steam. (Sure, a lot of them are hobbyist, but nonetheless.) And the ICO Steam newsletter lists numbers of weekly releases, and I know I saw a week with 260 releases recently. So the answer is - volume is up (June 2021 is 25% increased over June 2020, for example!), but not crazily.
On Nintendo Switch, I don’t know of a SteamDB-like site providing monthly release stats (if you do, ping me!) But there’s two newsletters that keep up with weekly releases: the ICO Switch newsletter (which is retrospective) and the Switch Weekly newsletter (which lists games coming out in the next week!)
Looking up Switch release numbers listed in the ICO newsletter, we can see: June 2020 newsletters: 39, 28, 31, 37 releases = 135 total, and June 2021 newsletters: 43, 32, 24, 36 releases = also 135 total. These aren’t EXACT month comparisons, because it’s four week rolling numbers. But it looks like Switch releases are broadly flat - at a much elevated number compared to 2017 or 2018 - year on year.
Anyhow, thought that was interesting - and if anyone has a lead on easy ways of tracking new PlayStation and Xbox releases by sheer number, feel free to follow up with us.
(Semi-related: we’re now going to be covering Switch _and_ Xbox ‘recent game’ top charts - by download counts - in addition to Steam Hype/results, via our Friday GameDiscoverCo Plus-exclusive newsletters.)
The game discovery news round-up..

OK, let’s round up the remaining game discovery news for the week with some kind of raffish style, shall we? Or at least we’ll manifest a shambling magnificence, as we secretly pretend to be Hunter S. Thompson covering the Kentucky Derby:
In more Valve lawsuit news, Ironberg Inventions is looking for $6.5 million in attorney fees after winning a $4 million suit around its controller patent for backward-facing ‘paddle’ buttons used on the Steam Controller. (Ugh, dumb patents. Xbox apparently pays Ironberg to use it, and it’s likely why Sony sells the DualShock 4 back button accessory separately.)
The ex-Typhoon Studios folks, who were bought by Google as an internal Stadia-centric studio, just span out again, and are rather honest about Stadia’s recent pivots: “Google is an amazing platform company with some of the best tech in the world. In my honest opinion, I think it just came down to the level of investment required to reach scale. From what we saw at Google, the sense was that if the initiative does not have the potential to reach billions of people, then it's better for them to deploy the workforce/capital into other areas.”
In ‘oh no another Steam x Argentina’ thread, the dev of Super Blood Hockey posted on Twitter about a 95% Argentina-skewed sales run on his game - which seemed pretty insane. But then a commenter pointed out: “Your game mostly sells in Argentina for a very simple reason : it's effectively free. It currently costs 7$ARS while the Steam trading cards it drops can be sold for 10$ARS. It's as simple as that.” So this is Venezuela-style virtual gold farming, but for Steam cards? (The game is USD $4.49, and a USD 43 cents equivalent in Argentina, btw.)
Microlinks: Unity spending $320 million on the dev remote desktop tool Parsec is an interesting pickup for the dominant engine company; some quarterly console sales estimates from Ampere show major trends, though PS5 is still very supply-limited; Quantic Foundry’s look at the preferred playable character gender for players is some super-intriguing data.
Interesting to see some U.S. senators picking up on a relatively little-reported upcoming UK kids code and making it clear they want it to apply in the U.S. too: “The new rules force companies to design their products in the “best interests” of children, offer stricter privacy settings and policies for different age groups, and restrict “nudging techniques” often used to encourage users to continue using the service.” It’s not really a law, though, so enforcement may be unclear. Also notably: “the lawmakers argued that the ESRB’s loot box guidance does not go far enough in protecting children from “manipulation” associated with these in-game purchases.”
Microlinks, Pt. 2: It’s interesting to see China’s perceived tech/games crackdown even affecting the IPO of South Korean PUBG parent company Krafton; the making of Panic’s Playdate handheld is covered wonderfully in their recent podcast & transcript; the latest Steam weekly charts have been showing a raft of new games - The Ascent, Tribes Of Midgard, and even the unreleased Back 4 Blood - dominating the charts for a change!
Finally, imagine us at GameDiscoverCo, as data nerds, discovering a Valve document in the Apple vs. Epic lawsuit document cache, eagerly opening it, and discovering… this. (We’re still crying theatrically and cursing the redactions.) See you next week!


[We’re GameDiscoverCo, a new agency based around one simple issue: how do players find, buy and enjoy your premium PC or console game? You can subscribe to GameDiscoverCo Plus to get access to exclusive newsletters, interactive daily rankings of every unreleased Steam game, and lots more besides.]