Revealed: the state of Steam wishlist conversions & 'long tail' in 2024
Publikováno: 15.4.2024
Lots of data around short and long-term PC game performance for your brain.
[The GameDiscoverCo game discovery newsletter is written by ‘how people find your game’ expert & company founder Simon Carless, and is a regular look at how people discover and buy video games in the 2020s.]
After a truncated newsletter week, we’re back, baby. And much like Larry David in Curb Your Enthusiasm, we haven’t learned a thing - and we’re proud of it! (Oh dear.) So let’s get back to action, starting with much-awaited Steam survey results…
Also: thanks to this week’s newsletter sponsor, user-generated content distribution service mod.io. If you’re interested in getting your message out to our 25k+ readers, here’s advertising info, or just hit us up direct.
[HEADS UP: our upgraded Plus game data suite is here - you can subscribe to Plus now to get full access to it, weekly PC/console sales research, an exclusive Discord, eight detailed game discovery eBooks - & lots more. Check out this recent newsletter for details on new features.]
The state of Steam wishlist conversion & long tail!
The last surveys we did on Steam ‘wishlists to sales’ at launch and on long tail revenue was all the way back in late 2021. So we were well overdue a follow-up - and thanks to the 100+ games that anonymously contributed to our 2024 version of this survey.
The point of the survey - which only allowed data from Steam games launched since 2020 - was clear. With a (limited, but real!) set of data, could we see any long-term changes in game conversion or sales due to the flood of new games in recent years?
Firstly, we tackled 'this question: if your wishlist balance is X at launch, what multiplier of X sales might your game get (both wishlist conversions and organic puchases!) by the end of the first week on sale?
In 2021, we found that this ‘conversion’ metric varied drastically - around a median of 0.20x across all sizes of game. But it was as low as 1/10th of that number, and as a high as 5 times it or more. (This ties in with Valve’s comments on relative lack of correlations between wishlists & predictability - tho you should still care about them!)
Surveying across all games, the ‘new’ median ratio was again 0.2x. It hasn’t changed! And just looking at games that launch with >10k wishlists - excluding the tinier hobbyist titles, it was 0.17x. Here’s the shape of that graph:
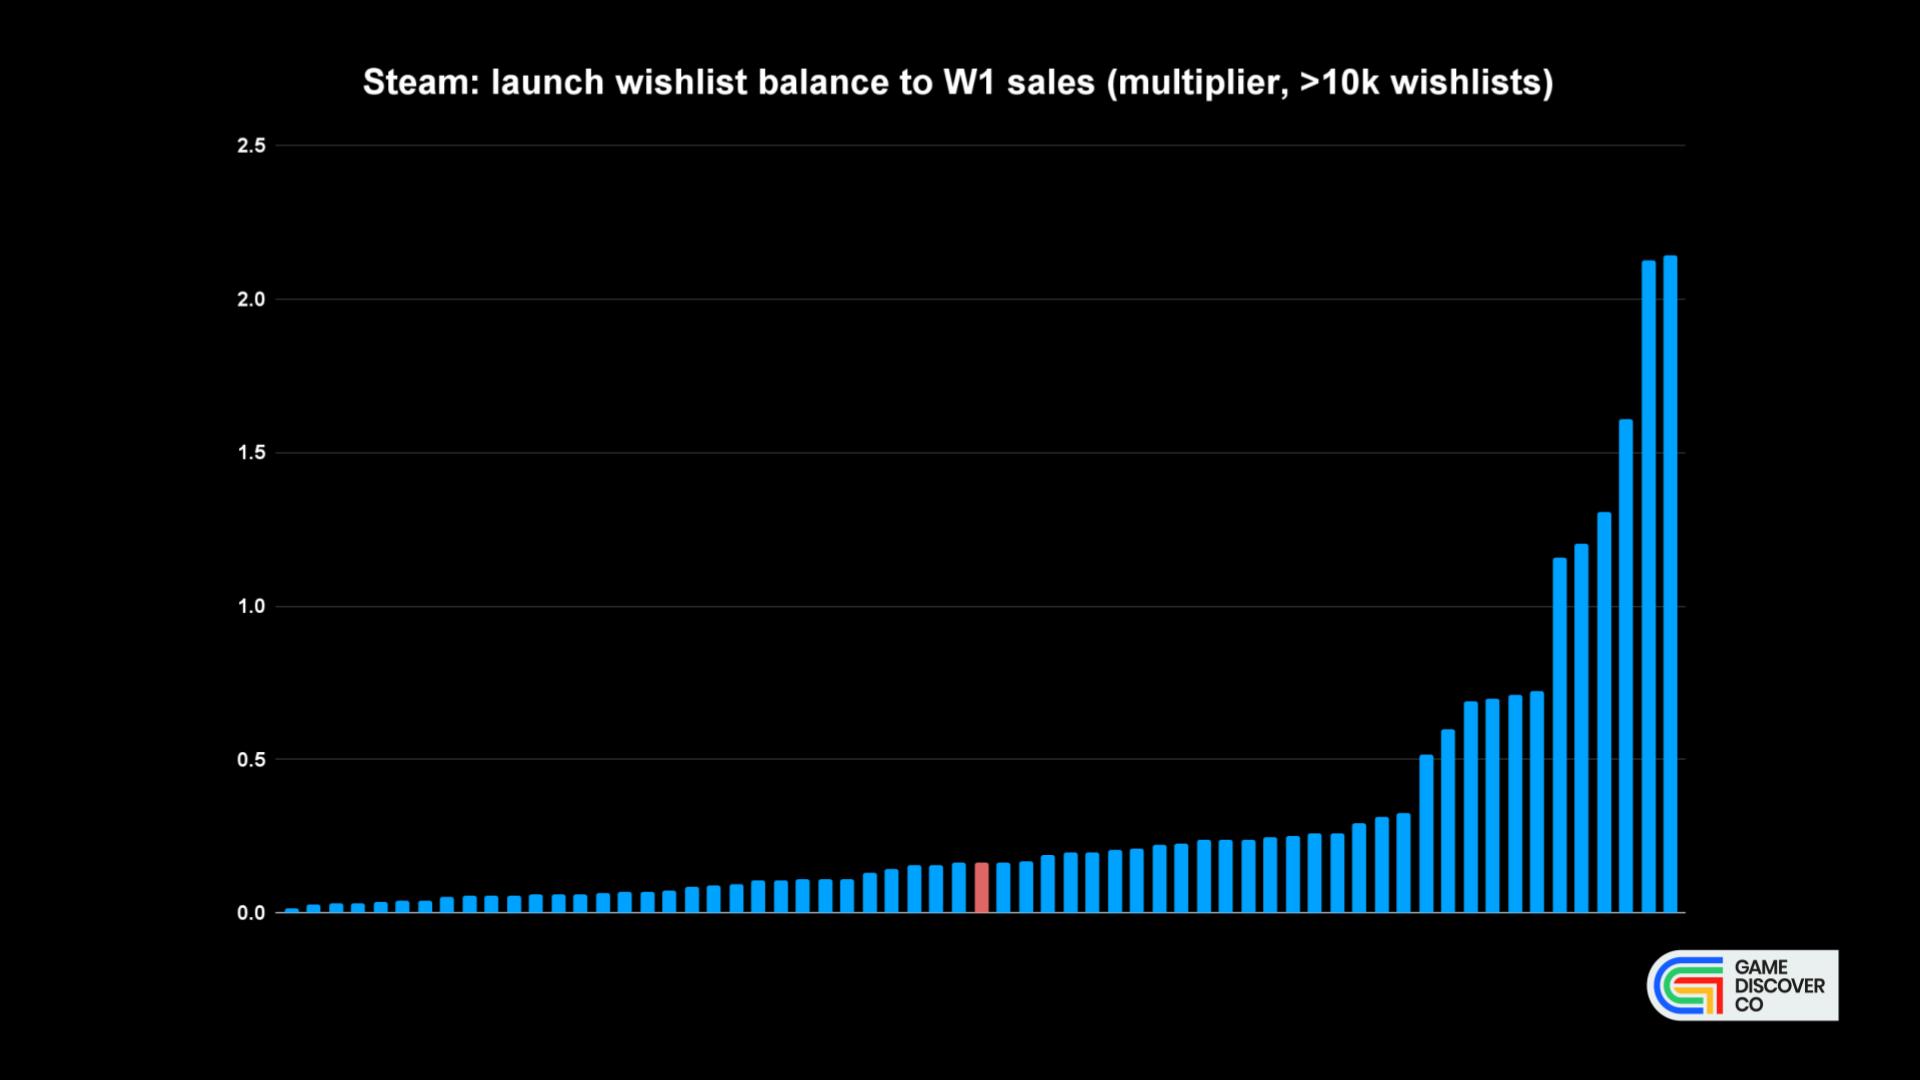
So - yes, you can see why predictability is so tough here! The results are all over the place. We track a similar public metric (Hype score → Week 1 Steam review #s) in our Plus back-end, and if you look at March 2024’s results, games of this size range from a conversion of 22x the normal (A Difficult Game About Climbing, which went viral at launch) to 0.07x the normal (Tchia, which released on Epic Games Store first.) Wow.
What does appear to give you better predictability at Steam launch is follower or wishlist velocity directly before launch. But you will only know that… directly before you launch - not as helpful for planning. Still, continued organic interest is key.
We can also show this Steam conversion rate by size of launch wishlist balance, including the number of games we had in this cohort. (That’s just a representation of our sample size, not of overall market size on Steam!) Here we go:
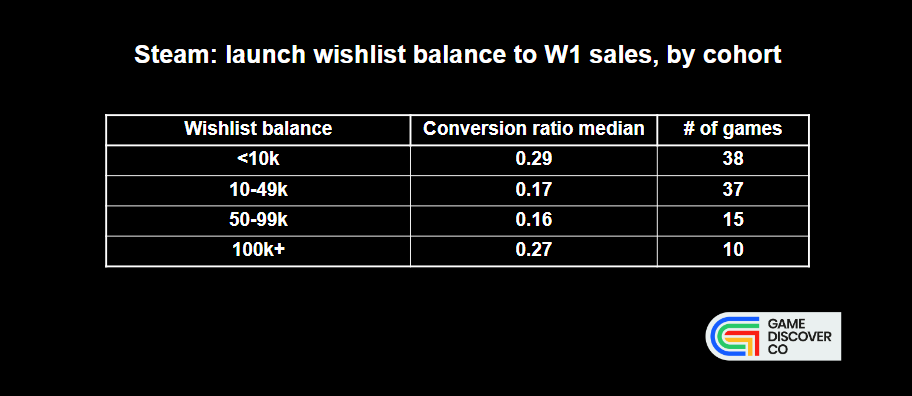
This isn’t very surprising, on the face of it. Games with hundreds or low thousands of launch wishlists only need to pick up a bit of organic interest to ‘outperform’. But it’s also intriguing to see a better conversion ratio on the higher end (>100k wishlists.)
And on conversion as a whole, there’s hints that outliers could be getting ‘more so’ in the current market. If you look at the previous 2021 graph, it topped out at 1x - though we removed one or two outliers. But this time, there’s six games at >1x.
Could this just be that viral titles happen to be filling out the survey, and we have a small sample size? (Absolutely!) And we think those high-conversion games are probably over-represented in our survey, compared to Steam as a whole.
But we do know that ‘big games get bigger’ is a trend. Why not here too? (Oh, and we peeked at the top-converting games. The highest ones have 15-30k wishlists at launch and did 1.5 or 2x those sales in Week 1. But there is one giant >100k wishlist outlier in there.)
Launch in-game & cross-platform UGC with our sponsor: mod.io

mod.io offers a complete solution for user-generated content distribution; on any platform from PC, to consoles, mobile and VR. Plugins for Unreal and Unity, and a SDK for custom engines make implementation easy for all games.
Built as a white label solution, mod.io services allow you to create a fully tailored experience for your UGC creator community (in-game & web custom UI, SSO, moderation rules, real-time metrics); keeping your players engaged in your own ecosystem.
Reach out to discussUGC implementation, or sign up to our newslettercovering our latest product updates, and industry trends.
But how about ‘long tail’ sales on Steam over time?
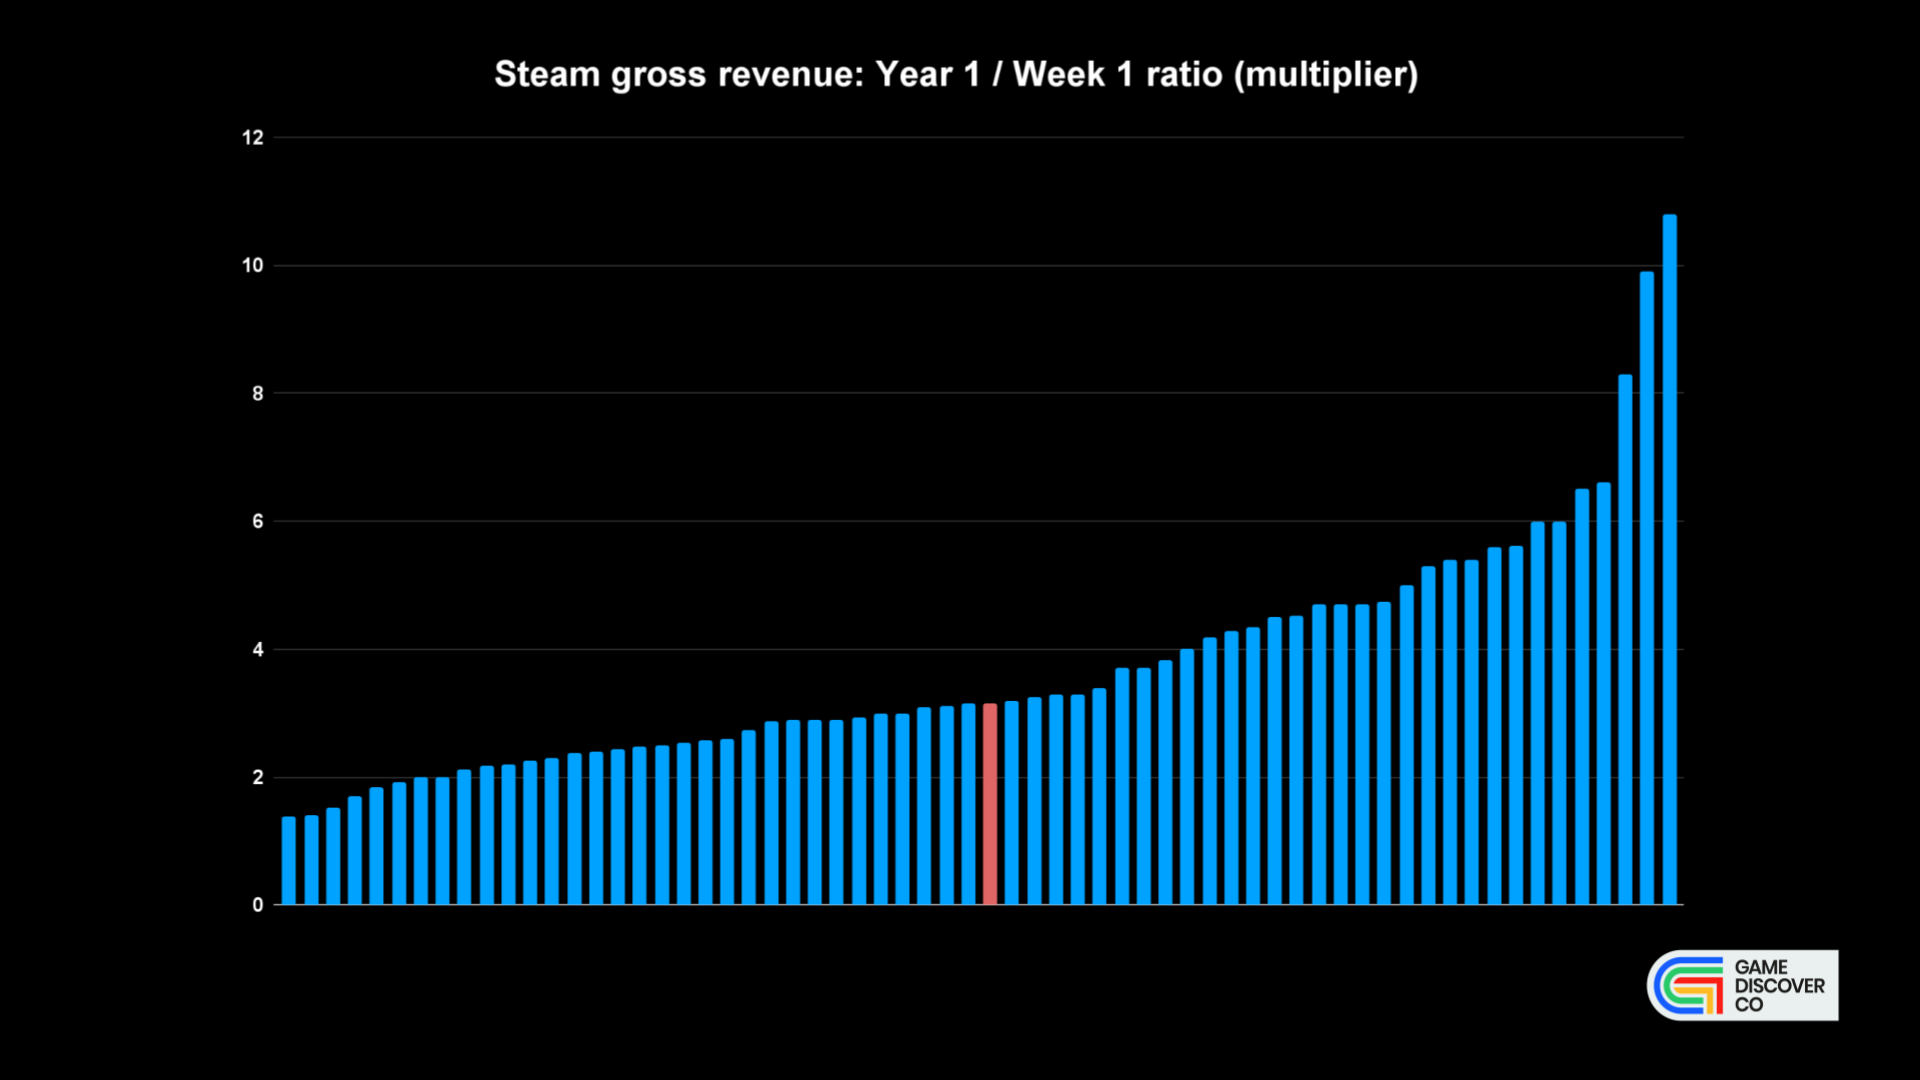
The other thing GameDiscoverCo surveyed in-depth was gross revenue. If you have $50k in gross revenue for your game at the end of Week 1, how much could you have at the end of Year 1? We wanted to see if this had changed since 2021’s survey.
Above are this year’s results for games released from 2020 to 2023, which show a broad range from <2x to >6x, with Year 1 revenue being a median of 3.16x Week 1 revenue. And no, this really hasn’t changed much from the previous survey, where it was 3.05x, despite the market getting busier. (And we couldn’t spot clear YoY trends.)
Why would that be? Well, maybe people are getting better at revenue optimizing via discounts. Or maybe the ‘long tail’ hasn’t moved much - for any random game we sample - in the last 3/4 years. But hey, that’s what we can see. (We do suspect that Steam ‘long tail’ is down since 2016 / 2017, when there were so many less games.)
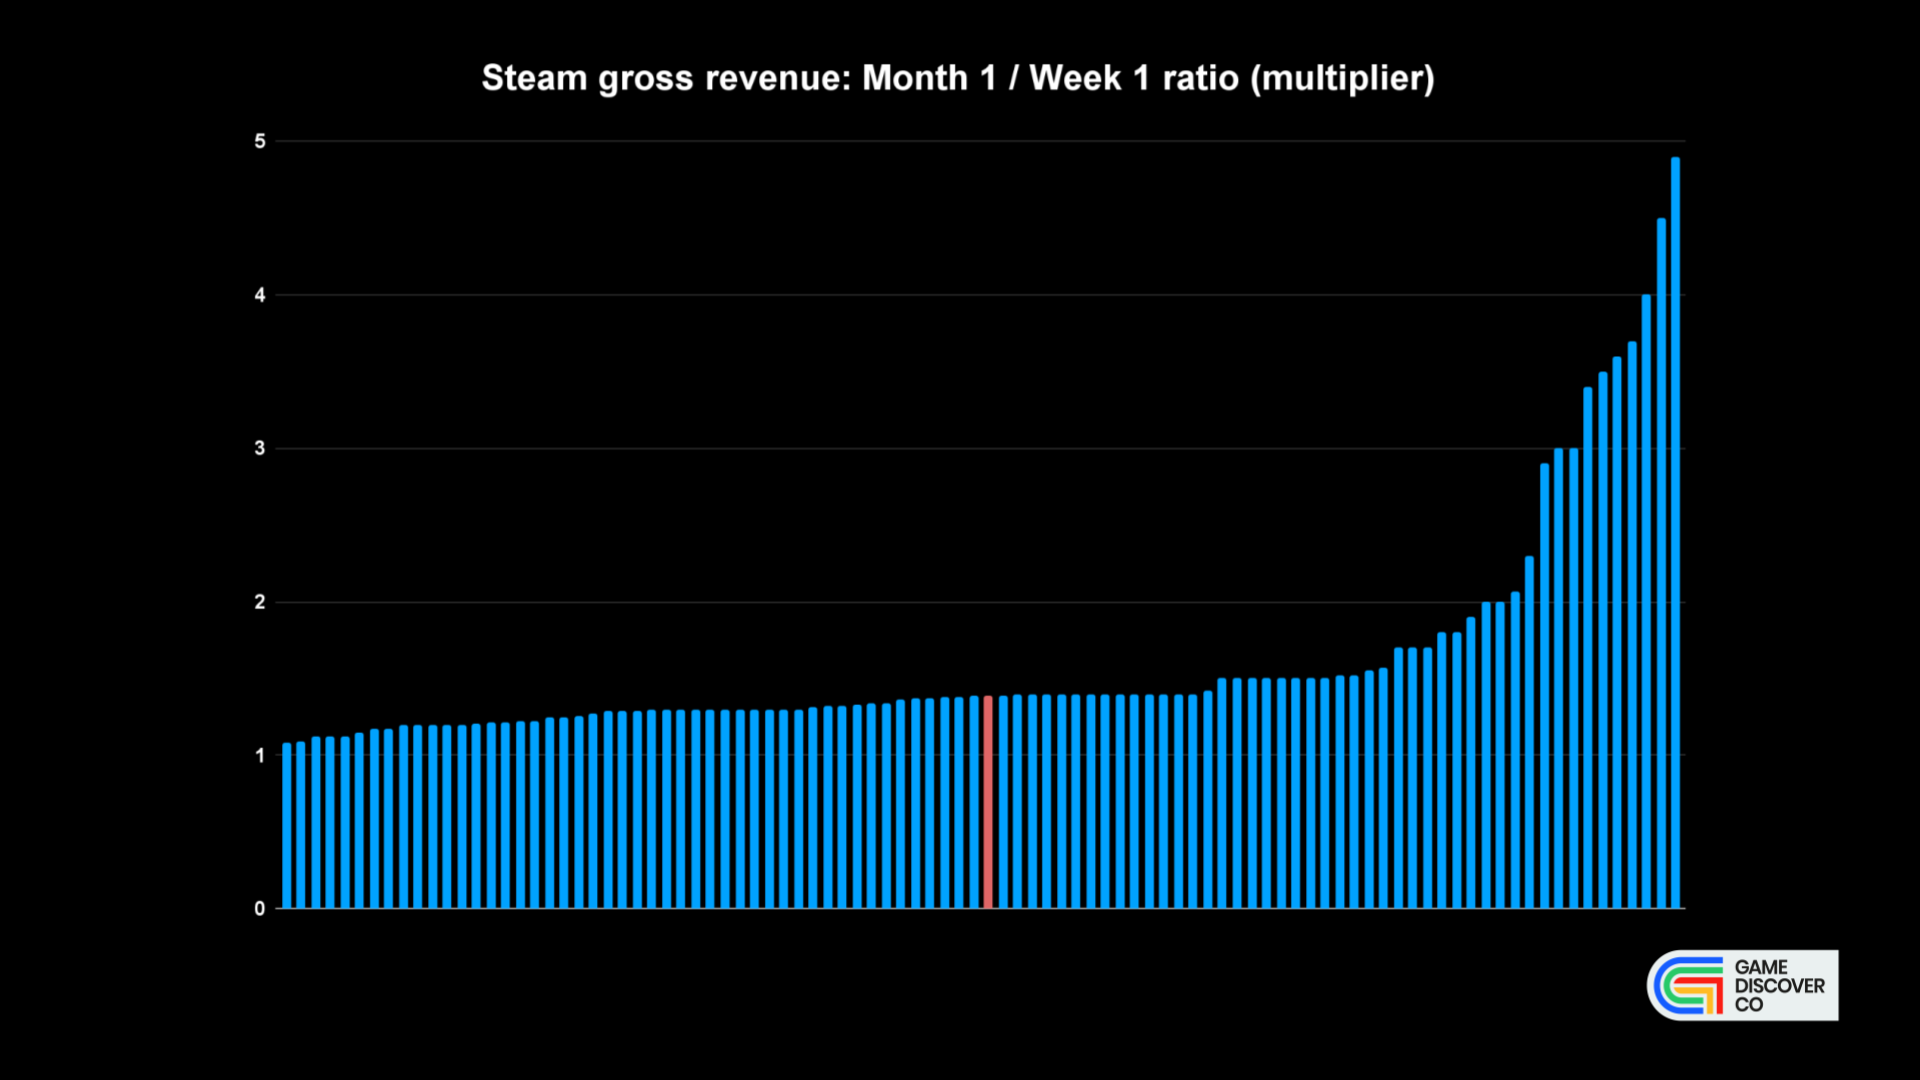
We should also run though all of the other ratios. Month 1’s gross Steam revenue median multiplier compared to Week 1 is 1.39x, slightly down from the 1.5x we had in the 2021 survey. (But Year 1 is pretty similar, so we don’t see any major trend shift.)
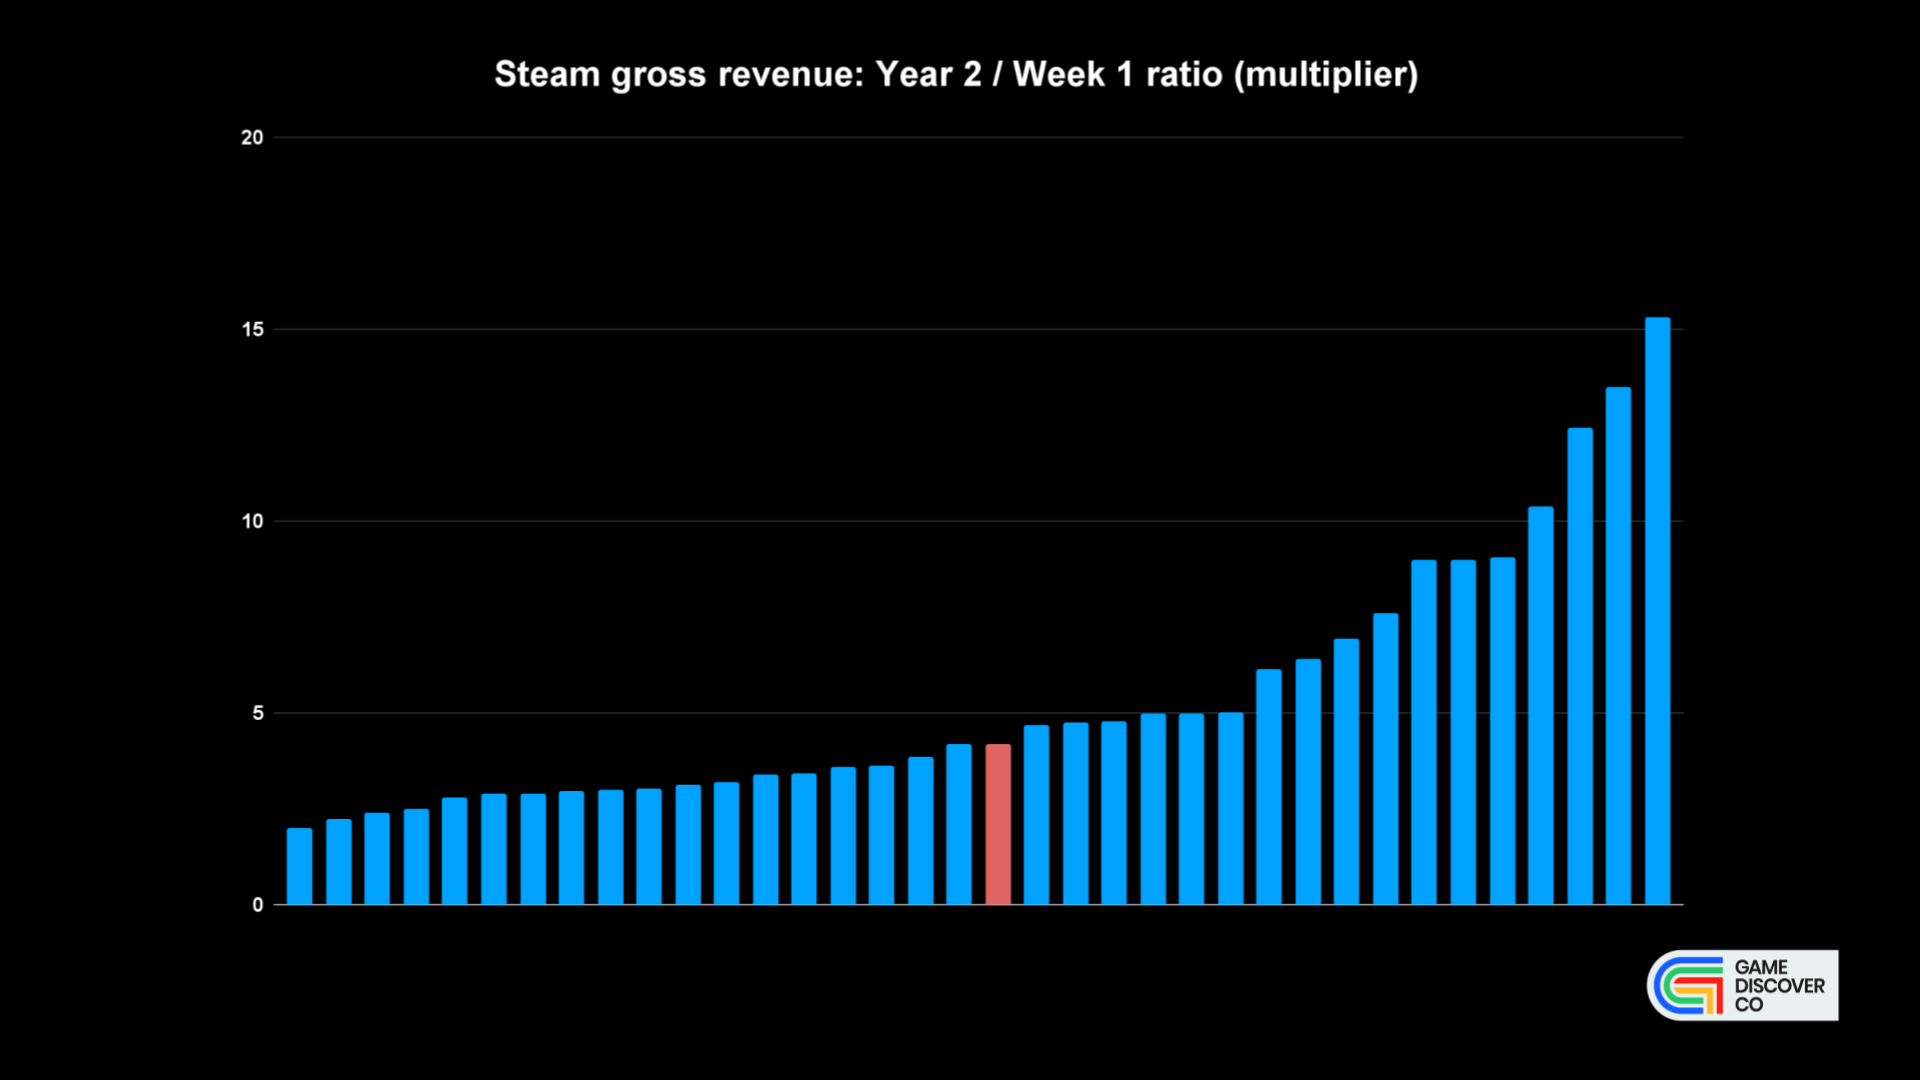
And then the total revenue at the end of Year 2* compared to the revenue at the end of Week 1 shows a median of 4.2x, which is.. exactly the same as the previous survey! (*This is all of the first two years’ revenue, not just the second one, just to be 100% clear!)
But some of the outliers - presumably GaaS titles or games with continued reach - are managing to make it closer to 10x revenue - or even over that, in a couple of cases. Finally, we did get a ‘end of Year 3 / Week 1’ median ratio - 5.5x - but it’s for only about 10 games. Still, nice to have a ‘straw man’ to poke at…
Conclusion: so what if the issue isn’t conversion or long tail?
Finishing up, we see one vital point: if there are lots more games entering the market, but no major changes in trends, we’ve spotted something key - this data won’t show the biggest problem for new PC/console games - increased competition.
If 3x as many games are investing 5x as much time and money to target a market for new games that is 1.5x as large (these are ‘straw man’ numbers, but you get the idea!), sampling a small % of them won’t show any difference. Which is what we see!
The issue here is the sheer number of titles, and the resulting ROI (return on investment) math(s) - as well as teams working on larger follow-ups, while people are still buying significantly discounted versions of the first game and its peers.
In this scenario, you will get more games that have trouble recouping in this market. (A market I believe we are in.) And that’s - ultimately - the hidden issue here. But now you all have updated ratios to do your median financial plans from, at least? Huzzah.
The game platform & discovery news round-up..
Since we last published the free newsletter a few days back, there has been ‘a lot of new info’ to look through on the discovery & platform side. So… let’s do it:
PlayStation news? The top PS4 & PS5 downloads for March 2024 saw Helldivers 2 (unsurprisingly!) topping the U.S. & European PS5 charts, followed by sports games & Dragon’s Dogma 2; April 2024’s PlayStation Plus Game Catalog selection is interesting because it’s no longer solely ‘12 month old AA/AAA games’, adding both The Crew 2 but - in our view - more indies (Dave The Diver, Nour, more…)
Devs, be aware that crooks may be impersonating you to influencers, in order to get them to download trojans & take over their social/other accounts, ugh. (We spotted this because 32-33’s Michal Napora replied on Twitter/X to a streamer re: The Invincible: “Don’t open [the scammers’] press kit, whatever you do.”)
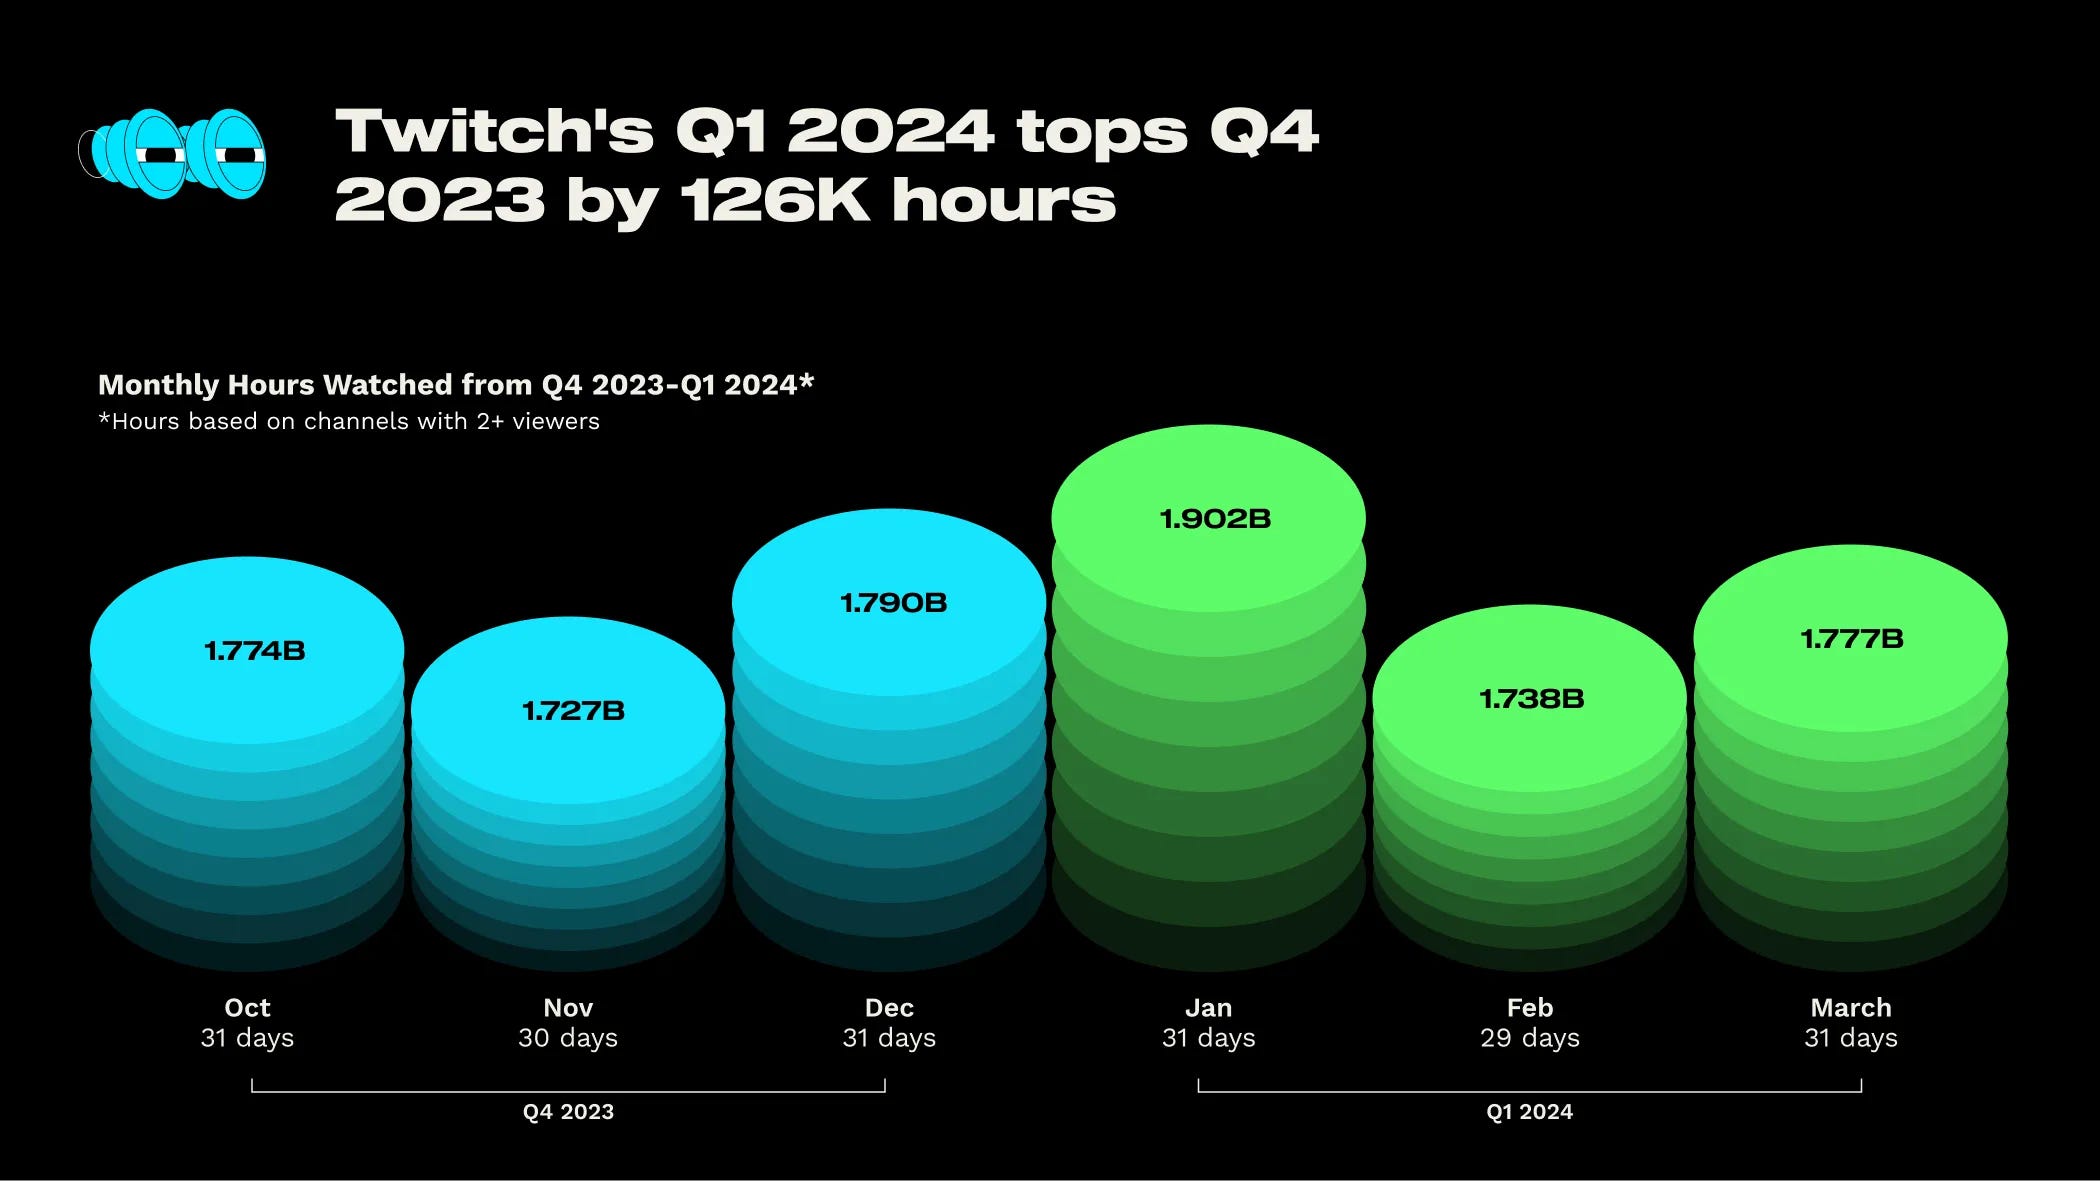
According to StreamElements & Rainmaker.gg’s look at Twitch game streaming in March 2024, total monthly hours watched are flat YoY at 1.78 billion (above), and we saw “only a 2% increase in hours watched quarter-over-quarter. In Q4 2023, Twitch had 5.3 billion hours watched and exceeded it in Q1 2024 with 5.4 billion.”
The Triple-I Initiative showcase we analyzed happened late last week - here’s the YouTube channel with all the trailers, and here’s an official recap of all the announcements. The general verdict? Promising, and nice to see a ‘beach-head’ at another time of year, but not incredibly different? (We await more, tho!)
Talking to IGN, as excerpted by VGC, Saber Interactive CEO Matthew Karch “believes the ‘$70 game’ will eventually become a thing of the past, as developers move to reduce costs and risk in an increasingly challenging AAA games market.” He thinks ‘middle market’ games like Helldivers 2 ($40) are better positioned…
Microlinks: Blizzard & NetEase’s China deal being back on means possibly “bringing new NetEase titles to Xbox consoles”, as Netease opts to rebuild the smashed Gorehowl statue; Apple Arcade’s May 2024 titles are all ‘App Store Greats’, including Dicey Dungeons+; Epic filed an injunction to stop Google from restricting third-party app distribution outside Google Play Store on Android.
The 20th BAFTA Games awards (livestream) happened late last week, and Baldur’s Gate 3 won four BAFTAs, including Best Game & the public voted Player’s Choice Award - with Alan Wake 2 picking up two, and Viewfinder getting Best British Game and Best New IP.
Fortnite stuff: Epic’s Saxs Persson noted in a GDC interview that IP holders like Lego “really, really care about the ecosystem we've made”, and less about Fortnite as a game. (True!) And some fans “are upset over the game's removal of cosmetic item rarities, which graded the game's vast vault of character skins, pickaxes, back blings”, etc
Looking at European physical (& select digital) sales for March 2024: “Helldivers 2… drops to No.2, but it's still delivering impressive numbers. EA Sports FC24 reclaimed its position at No.1.” Also, GI.biz’s Chris Dring left X/Twitter due to fan(boy) abuse, but dropped this data gem semi-related to GAME’s downward spiral before he did: “In the UK, sales of physical boxed games have dropped 45% since 2019.”
In ‘games as platforms’ news, giant MOBA League Of Legends has announced an Arena Mode comeback, and that “there will be a “bullet heaven” survivor PvE game mode that looks an awful lot like Vampire Survivors if descriptions and a screenshot are anything to go by.” More mode diversifications in the same game will continue.
Alternate platform-related microlinks: Apple News+ now has a daily word game called Quartiles; Rockstar’s GTA+ subscription service is now $8/month instead of $6; + the 360ft high MSG Sphere venue in Las Vegas is likely getting massive multiplayer games, according to a job ad (via Lowpass.)
Finally, the very niche but fun Dungeon Investing blog points out that Japanese site P-World has a chart ranking of Japanese pachinko machines with the actual machine pics, which are all pretty wild. The top charting pachinko game right now? It’s a Neon Genesis Evangelion one, of course. And just look at its hardware design:

[We’re GameDiscoverCo, an agency based around one simple issue: how do players find, buy and enjoy your PC or console game? We run the newsletter you’re reading, and provide consulting services for publishers, funds, and other smart game industry folks.]