Which countries dominate Steam bandwidth usage in 2024?
Publikováno: 29.4.2024
We have the data, direct from Valve. Also: Xbox analysis and lots of news.
[The GameDiscoverCo game discovery newsletter is written by ‘how people find your game’ expert & company founder Simon Carless, and is a regular look at how people discover and buy video games in the 2020s.]
Welcome to a fresh week of game discovery goodness, folks. And we’re as excited as ever to be facing the information deluge alongside you, tapping and refining it to create pure ‘takeaway gold’. (Or that’s the idea.)
BTW, after our Backpack Battles ‘how they did it!’ newsletter, we got a request: why not showcase more games that didn’t quite deliver sales-wise, despite being high quality? We have done this before, and would like to again - ping us if interested.
[REMINDER: you can support GameDiscoverCo by subscribing to GDCo Plus now. You get full access to our Steam data back-end for unreleased & released games & weekly PC/console sales research, Discord access, eight detailed game discovery eBooks - & lots more.]
Steam: which countries dominate bandwidth use?
One of the things we appreciate about Steam as a platform is the transparency it offers into things like gross revenue rankings, CCU, and even - something not often discussed or analyzed - total bandwidth utilized by players on the platform.
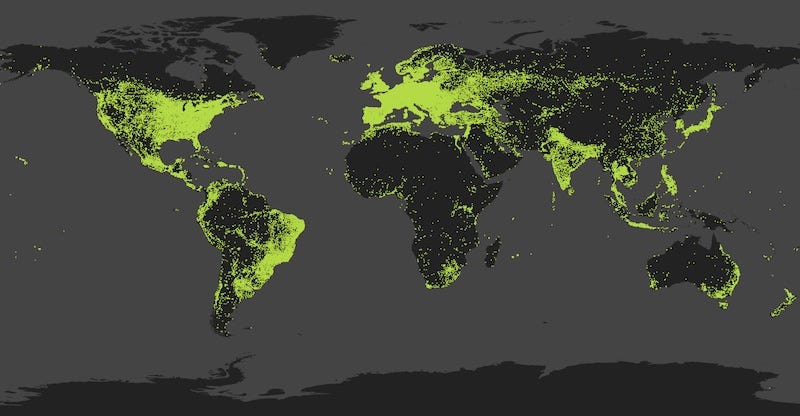
This official Steam page - viewable both by country and also by a denser geographical heatmap (above), hasn’t been analyzed much. (How do we know? We looked at it recently and discovered part of it was down - thanks to Valve for fixing it quickly!)
Now, we know that bandwidth used doesn’t map cleanly to unique players on the platform. Some countries may play more bandwidth-heavy games that others, have larger game catalogs that require updating more often, and so on.
But it’s a pretty good indication of country and region-based interest in Valve’s PC game platform. And you can extract specific percentages from the interactive map, which we did to this Google Drive doc, and then visualized it:
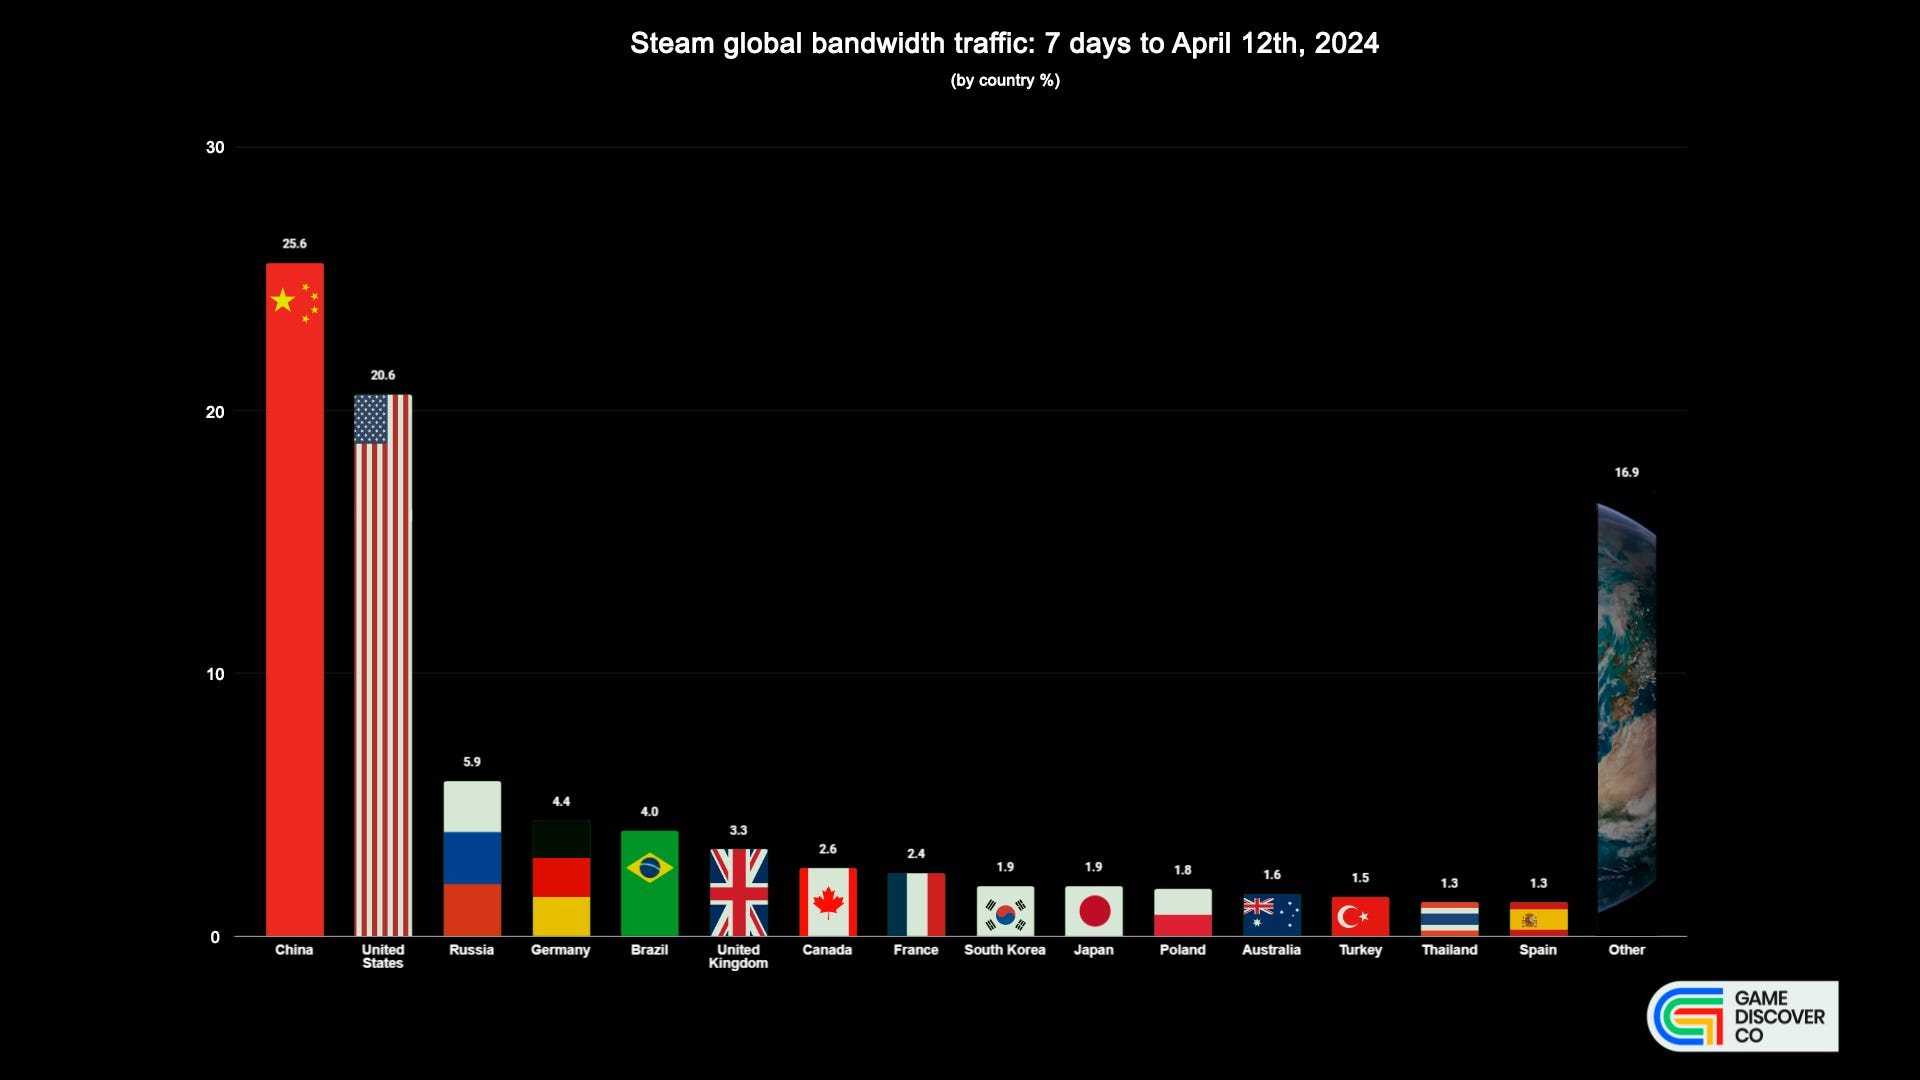
Some interesting trends here? Seeing China with 25.6% of global Steam bandwidth, followed by the U.S. ‘only’ at 20.6% might surprise some. But the grey-market use of Steam Global in China continues to flourish over time.
In fact, in data we grabbed in early Feb. 2024, China was at 24.7% - so we did see a 0.9% increase in a couple of months. (But that might have been cyclical, or tied to a particular game excelling in that country. We’ll continue to monitor it.)
Another interesting stat is the Russia Federation capturing 5.9% of global Steam bandwidth - down 1.6% since our Feb. snapshot. Valve has never directly blocked Russians from playing games, or even buying new ones*, a subject of much discussion. (*Though many publishers have region-blocked their games, and direct payment methods were cut off by PayPal and credit card companies, leading to weird workarounds.)
The other major countries in the above bandwidth snapshot are Germany (4.4%), Brazil (4.0%), the UK (3.3%), Canada (2.6%), France (2.4%), Japan (1.9%), South Korea (1.9%), Poland (1.8%), Australia (1.6%), Turkey (1.5%), and - notably - Thailand (an up-and-comer at 1.3%) and Spain (1.3%).
There were another two countries (Argentina and Ukraine) above 1.0%, another 12 countries above 0.5%, and a grand total of 65 countries with at least 0.1% bandwidth usage on Steam over the last 7 days. It’s a truly international marketplace, folks…
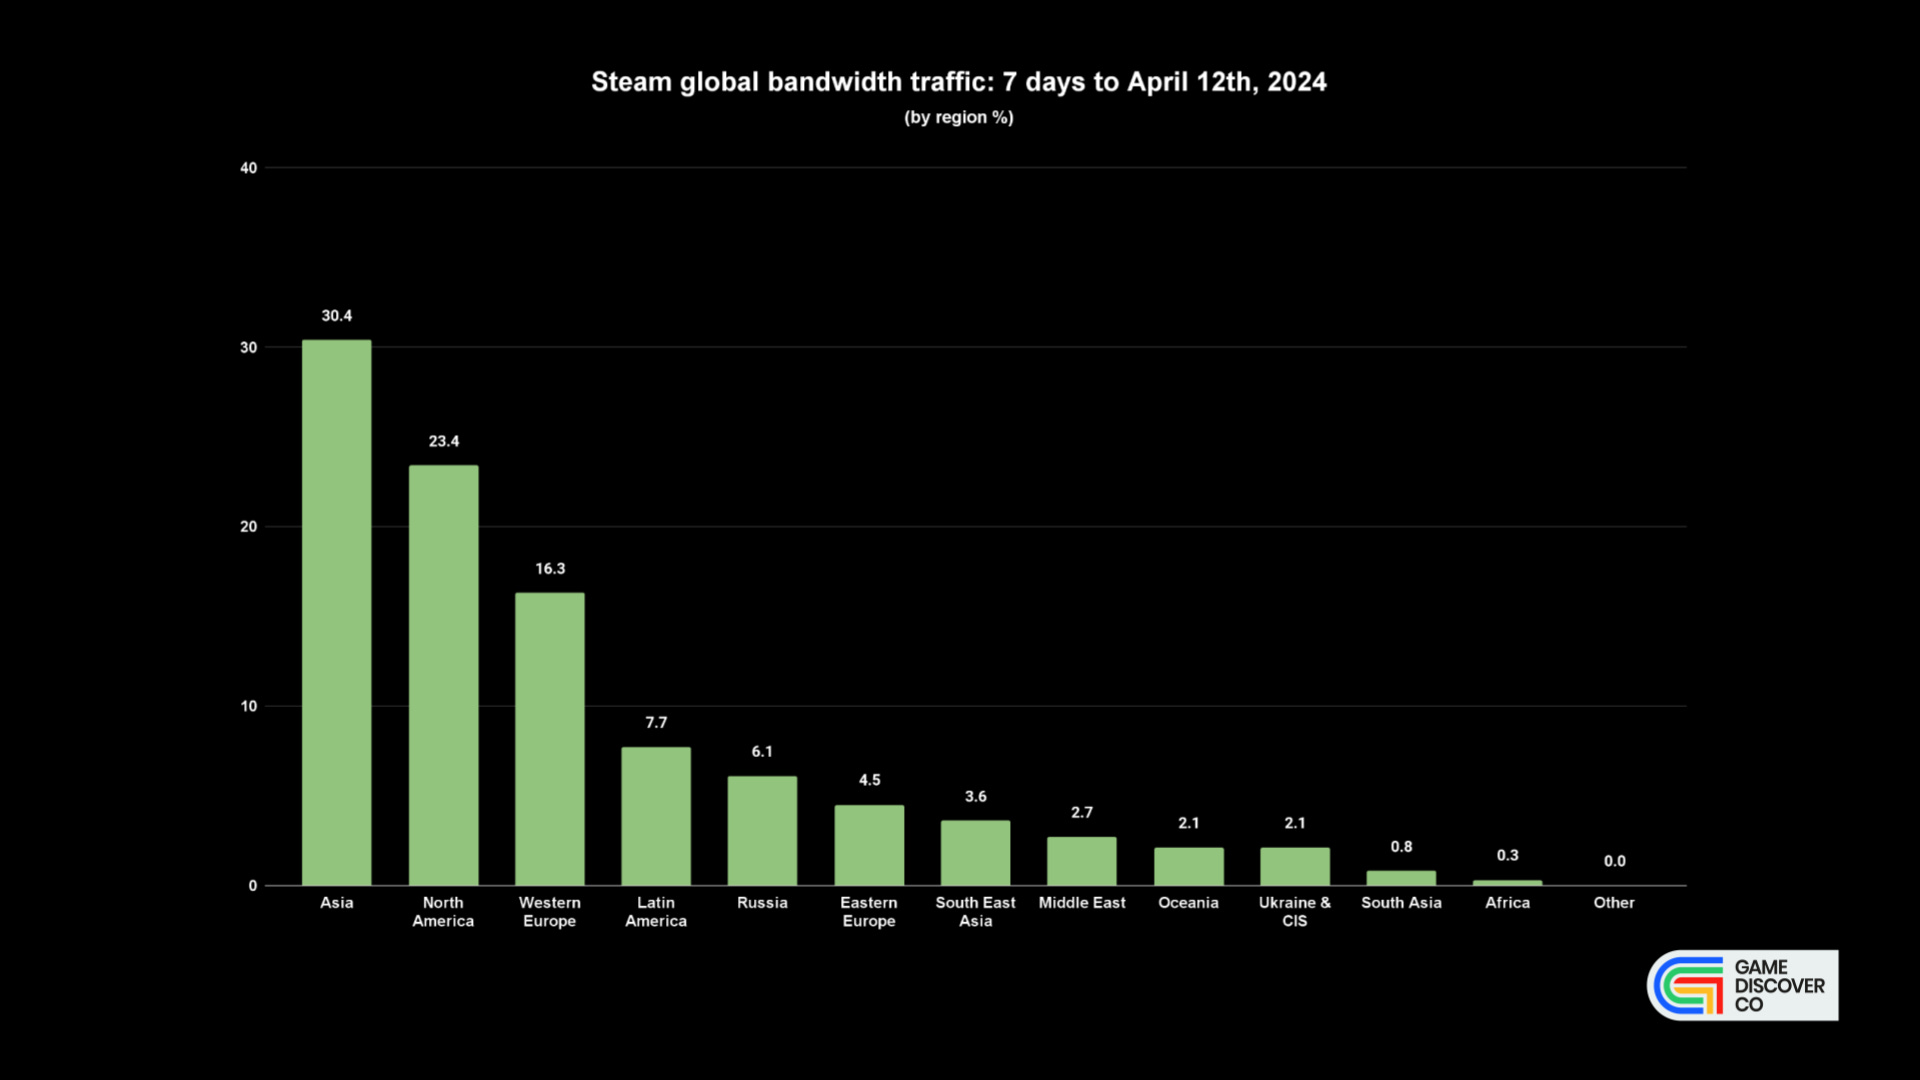
Here’s the breakdown by region, with Asia at 30.4%, followed by North America at 23.4%, Western Europe at 16.3%, Latin America at 7.7%, the Russian Federation at 6.1%, Eastern Europe at 4.5%, South-East Asia at 3.6%, the Middle East at 2.7%, and down from there.
There are other things to consider when prioritizing - is your game culturally appropriate for that region, what’s the GDP & overall interest in buying premium products in that region?
And don’t forget, Chinese pricing for premium games is often around 45-50% of USD price. So if we’re taking bandwidth as a proxy for sales, more money is being made via U.S. players than Chinese on Steam, despite higher bandwidth usage. Fascinating.
Xbox’s surprising hardware slowdown, in context..

Some of you may have spotted Microsoft’s financials late last week - generally pretty impressive, with revenue up 17% to $61.9 billion and profit up 20% to $21.9 billion, led by Azure & Office365, and with help from the finally-closed Activision Blizzard deal.
The headline notes?: “Xbox content and services revenue increased 62% [year on year] (up 61% in constant currency)” - but that was “driven by 61 points of net impact from the Activision acquisition.” So - pretty much flat, not including the newly closed deal.
But that isn’t including Xbox hardware, and that’s where things get more interesting - hardware revenue was down 31% YoY (and down 30% in constant currency). And this is in a post-holiday quarter where you’d expect slower, but still continued demand.
Install-Base admin John Welfare also worked out the likely Xbox revenue splits (given they are not directly called out in MS’ financials!), and here they are, for the record:
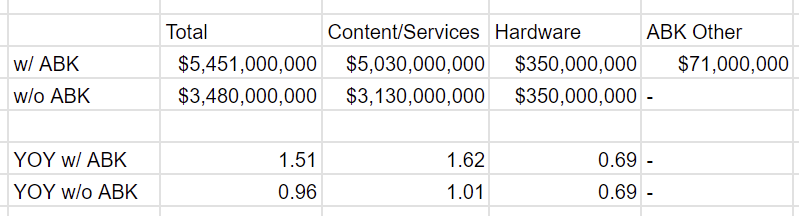
So why the poor hardware comp? If you look at Derek Strickland’s graph of Xbox hardware revenue (above) - you can see one reason - Series X was supply-constrained for Holiday 2022. So holiday 2022 was ‘artificially’ lower than holiday 2023, and some of that holiday 2022 revenue probably spilled over to calendar Q1 2023.
This makes ‘year on year comparisons’ even tougher than they would be otherwise. (We also don’t know how much discounting affected recent revenue.) But even though it was a tough comp - and Microsoft mentioned as much, last year’s calendar Q1 was, itself, down 30% on the previous year.
So what’s going on? Ars Technica has a good piece discussing it, noting: “Previous Ars analyses have shown PlayStation consoles generally see their sales peaks in their fourth or fifth year of life, and Nintendo portables have shown a similar sales trend, historically. The Xbox Series S/X progression, on the other hand, looks more similar to that of the Wii U.”
Well, we’re not sure we would go as far as comparing it to the Wii U. But we agree with Ars’ Kyle Orland when he says: “Significant declines in Xbox hardware revenue for four of the last five quarters stand out relative to competitors' unit sales.”
So, is Xbox losing market share to PlayStation, or are all of the high-end consoles finding shortened runways, due to the mature nature of the console market? We haven’t seen clear data, but we’d wager - a little from column a, a little from column b?
And it can’t help that a number of 2024’s most-discussed console titles* so far - from Helldivers 2 to Stellar Blade, and even Rise Of The Ronin - are on PlayStation 5 and not Xbox Series. (*Palworld on Game Pass was Xbox’s big 2024 win, but we wonder how much $ upside it drew? The diversification of hit Xbox IP like Sea Of Thieves and Grounded to other console platforms makes lots of sense, in this context.)
The next quarter - April to June 2024 - looks non-optimal for the Xbox division too, with its own estimates saying: “Total: growth in the low to mid 40's with ~50 [percentage] points impact from Activision; Content and Services: growth in high 50's with 60 points impact from Activision; Hardware: decline [year on year].” So: down, without ATVI.
Microsoft is doing great overall, and its non-game divisions with % growth in the teens can hold up Xbox for an extended period of time. But the Activision Blizzard deal was done to unlock growth and shift strategy, not just ‘buy profitable revenue’. So that’s really going to need ‘proving out’ over the next few quarters…
The game platform & discovery news round-up…
Finishing off this newsletter, we’ve got more platform & discovery info! For you! In surprising shapes and sizes! Let’s interrogate it:
Veteran game dev (and ex-Steam contractor) Ichiro Lambe has been scanning for ‘AI content’-labeled games on Steam, and says there’s >1,000 already. What’s he surprised by? “The sheer number of games on Steam that use the tech.. the fact that devs are already using it across small and large games… the breadth of use cases.”
Larian’s director of publishing Michael Douse has put out a v.good Twitter/X thread on why Baldur’s Gate 3 “doesn’t have a credited marketer”, followed by a further thread, both worth reading to cogitate upon, survivorship bias or no: “Authenticity is increasingly the only way to reach any serious social resonance.”
Apple things: maybe the company didn’t “cut Vision Pro production by almost 50% due to weak demand”, but this piece on Google & Meta stepping things up vs. VisionOS & iOS adds: “One [Apple] retail employee says they haven’t seen one Vision Pro purchase in weeks, and that the number of returns equaled the device’s sales in the first month that it was available.” Finally: Apple’s walled garden is under some stress.
In more ‘devs, be careful with your Steam logins’ news, but in a slightly different flavor, “a ‘compromised account’ got its hands on the Steam page of [Path Of Exile]… and posted a [news post] instructing fans to follow a link to apply for early access of the sequel.” (Readers, it was a phishing link.)
Microlinks: surveying 700 Japanese Gen Z-ers reveals an interesting game device ownership split: “Mobile 94.7%; Nintendo Switch 38.5% ; PC 33.2% ; Tablet 26.5%; DS 12.2%.”; Blizzard’s large-scale BlizzCon physical event will not be happening in 2024; are U.S. video game addiction lawsuits “having a moment”?
File this under ‘Switch 2 rumors too goofy to be false’: “[Nintendo] accessory manufacturers have been able to touch the [new] console but not see it… it’s a bit bigger than current Switch models, but nowhere close to the Steam Deck's size. Joy-cons will change their attachment system from rails to a magnetic system.” Still ‘early 2025’, btw.
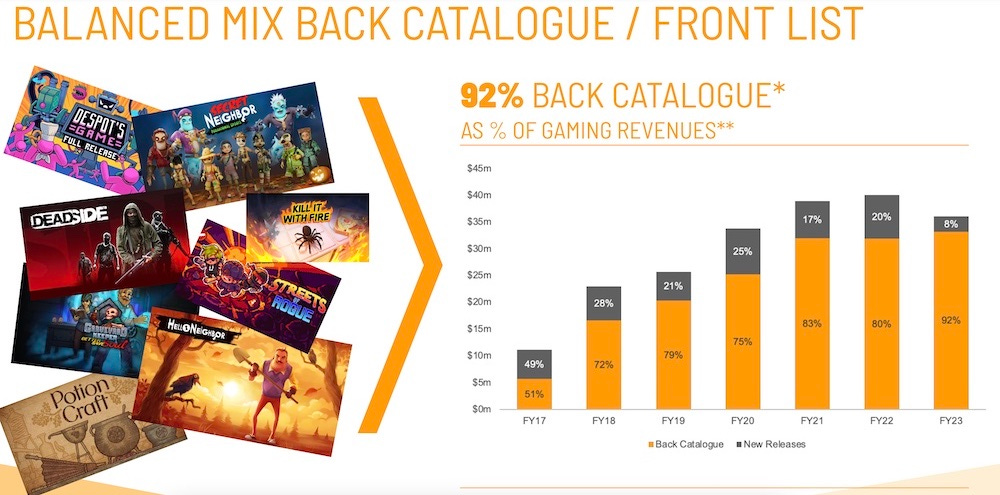
After Devolver’s 2023 fiscal results came Tinybuild’s, summarized handily by Game World Observer: “Back catalog sales accounted for 92% of total revenue [above], up from 80% in 2022.” Also notable in the full results .PDF - platform deals were down a giant 67%, with “mitigating factors (e.g. lower cannibalisation) still difficult to quantify.”
Steam has published its top new games & DLC of March 2024 as a sale page, and while GameDiscoverCo Plus subscribers will recognize most of the top games from our Friday newsletters, the ‘top DLC’ section is interesting, including a new Dead By Daylight chapter & a $20 pink fluffy bunny rabbit suit from The Finals. (!)
Fortnite’s player-created islands/levels are starting to diversify due to the extra UEFN functionality, with Zach Eller highlighting the Tycoon craze: “Currently there are 6 Tycoon maps in the top 50 UEFN maps, half of which were launched in the last week… This makes Tycoon the 3rd most played category in the top 50.”
No Rest For The Wicked’s Thomas Mahler has penned an ode to Steam Early Access on Twitter/X, saying: “We're not even a week into Early Access and it's already pretty clear that going with EA is one of the best decisions we could've made.. there is just no way we could have ever shipped Wicked 1.0 without being able to see all the data we're seeing now and getting all the feedback from users.”
Other media links: how Magic: The Gathering is using big crossover IP like Fallout, Marvel & Final Fantasy to juice sales; here’s a look at what’s going on in U.S. video (TV, streaming movie) revenue, which is a) complex b) stagnant-ish; Phish’s latest Las Vegas Sphere megashow used Unreal Engine & Notch: “we’re now playing real time content in 16K by 16K”; how much money bands make on tour.
Finally the ‘made-up NES/Famicom cartridge labels’for the Famicase 2024 exhibit have started appearing, and of the highlights so far, we really dig Pete Ellison’s Capybath!:

[We’re GameDiscoverCo, an agency based around one simple issue: how do players find, buy and enjoy your PC or console game? We run the newsletter you’re reading, and provide consulting services for publishers, funds, and other smart game industry folks.]