Which PC games had the largest 'long tail' in 2024, and why?
Publikováno: 15.4.2025
Also: lots of analysis of expected long tail, and tonnes of news.
[The GameDiscoverCo game discovery newsletter is written by ‘how people find your game’ expert & company founder Simon Carless, and is a regular look at how people discover and buy video games in the 2020s.]
Oi, it’s us again. You know, GDCo, the folks who invade your inbox unceremoniously with a variety of factoids, opinionoids, and graphoids. (No gyroids, though, for some reason.) And today we have a bunch of neat ‘long tail’ data for you, or yer money back.
And before we start, have you checked out the latest Xbox brand trailer, ‘Wake Up’, co-directed by David Fincher (with French director Romain Chassaing)? There’s shades of Apple’s famed ‘1984’ commercial, with rodent (in this case!) dystopia overcome by, uhh, playing many ‘Xboxen’… Our tagline? ‘You’ll see why Xbox won’t be like Xbox.’ 😂
[USE OUR DATA: indies can help us by signing up to GameDiscoverCo Plus, inc. more from our second weekly newsletter, Discord access, data & lots more. And companies, get much more ‘Steam deep dive’ & console data access org-wide via GameDiscoverCo Pro, as 55+ have.]
Game discovery news: Marathon goes 26 miles up!
Starting with our customary wander through various game platform and discovery news, let’s get going here:
GameDiscoverCo's countdown of 'trending' unreleased Steam games by 7-day new follower velocity (April 7th to 14th), has Bungie's extraction shooter Marathon at (#1), thanks to its weekend reveal. (You won’t need a PSN account on your PC to play it, by the way, after that Helldivers 2 backlash.)
Elsewhere, titles in the Triple-I Initiative streaming event trended strong, including standout Snowpiercer-y 'moving base' reveal Frostrail (#2), a fresh look at spinoff Deep Rock Galactic: Rogue Core (#3), and ‘Rocket League but with humans’ game Rematch (from Sifu’s devs, #4). And horror-ish life sim Neverway debuted #6!
The PlayStation 5 got a price increase in Europe, the UK, Australia and New Zealand, due to “a challenging economic environment, including high inflation and fluctuating exchange rates.” So in Europe, the PS5 Digital price is now €500 (up from €400 at launch), and it’s £430 in the UK, up from £360 at the SKU’s launch.
There’s something rotten in the state of
DenmarkVampire Survivors cross-saves, as Poncle reveals a last-minute console cross-save hitch: “We've run into a legal issue on PlayStation.. that requires us to share info on our partners that we're unable.” Cross-save’s still launching on PC, Xbox, mobile. (Can anyone tell us the issue?)We can’t really sum up U.S. tariff news since last Friday’s newsletter in one paragraph, tho we’ll try: laptops and smartphones got exempted, but not video game consoles, but those exemptions are “only a temporary break while the government prepares more targeted import taxes on key technologies.” Hurray?
Related: on the ‘China vs. U.S. culture war’ front, China's video game regulator (NPPA) put out a statement: “The U.S. government's misguided imposition of excessive tariffs on China has severely hurt the feelings of the Chinese people. This will inevitably diminish the Chinese market's favorability toward American games and influence Chinese companies' decisions on importing such games. We will respect the choices of the market and the decisions of businesses.” (So no explicit public bans, just fee fees.)
March 2025’s most-downloaded PlayStation games, according to Sony, had Assassin’s Creed Shadows near-top of both U.S. and Europe charts, as well as Split Fiction and Monster Hunter Wilds performing well. On the F2P side, Marvel Rivals is still doing well - in the Top 5 in both territories, in fact.
Here’s a ‘hot take’ from dev Will Luton - that games’ ability to attract interest has been overtaken by (esp. visual!) social media: “I fear solving this issue is fundamentally impossible because the root cause sits well beyond ‘games’ - the unique [fun loop] we held a monopoly over is now being offered everywhere, better, easier and cheaper.”
Razer has launched its PC Remote Play project, and as Ars Technica explains re: the origin of this free ‘PC to mobile’ streaming tool: “Moonlight and Sunshine are the open source game-streaming client and server that wonderfully picked up where Nvidia's Gamestream left off. PC Remote Play is based on Moonstream's open source code, and Razer has made much of its own version's code available.”
In the movie space, as in games, original IP is also having trouble breaking through. And we suspect it’s a discovery problem - as the Wall Street Journal explains: “Building buzz for a new film in a media environment fractured between YouTube, TikTok, streaming and sports is tough, particularly when it is an unknown title.”
Esoteric microlinks: Piper Sandler’s latest ‘taking stock with [U.S.] teens’ survey shows “88% of teens currently own an iPhone”; one of the earliest mentions of AAA games is in a 1991 (!) U.S. trade mag; Brian Eno’s Windows reboot chime sound has been inducted into the Library Of Congress’ National Recording Registry.
The PC games with the biggest 'long tail' in 2024?

The question of ‘long tail’ for PC releases is always a fascinating one. It’s basically this: how does your Year 1 revenue (in this case on Steam!) compare to your Week 1 revenue? What $ can you expect to receive if you continue promoting and discounting?
GameDiscoverCo did an opt-in survey on this in April 2024, and from the 100+ games that submitted data, we saw “a broad [Week 1 to Year 1 revenue multiplier] range from <2x to >6x, with Year 1 revenue being a median of 3.16x Week 1 revenue.” So that’s handy - both a baseline - and an idea of variation - using ‘real world’ data.
But we also have our own (externally derived) GDCo Pro estimate data on revenue history. So we decided to look at all games that were new on Steam in 2023, and find the outliers in terms of W1 to Y1 revenue multipliers, now it’s >1 year later. First, here’s select biggest ‘long tail’ titles, based on our estimates:
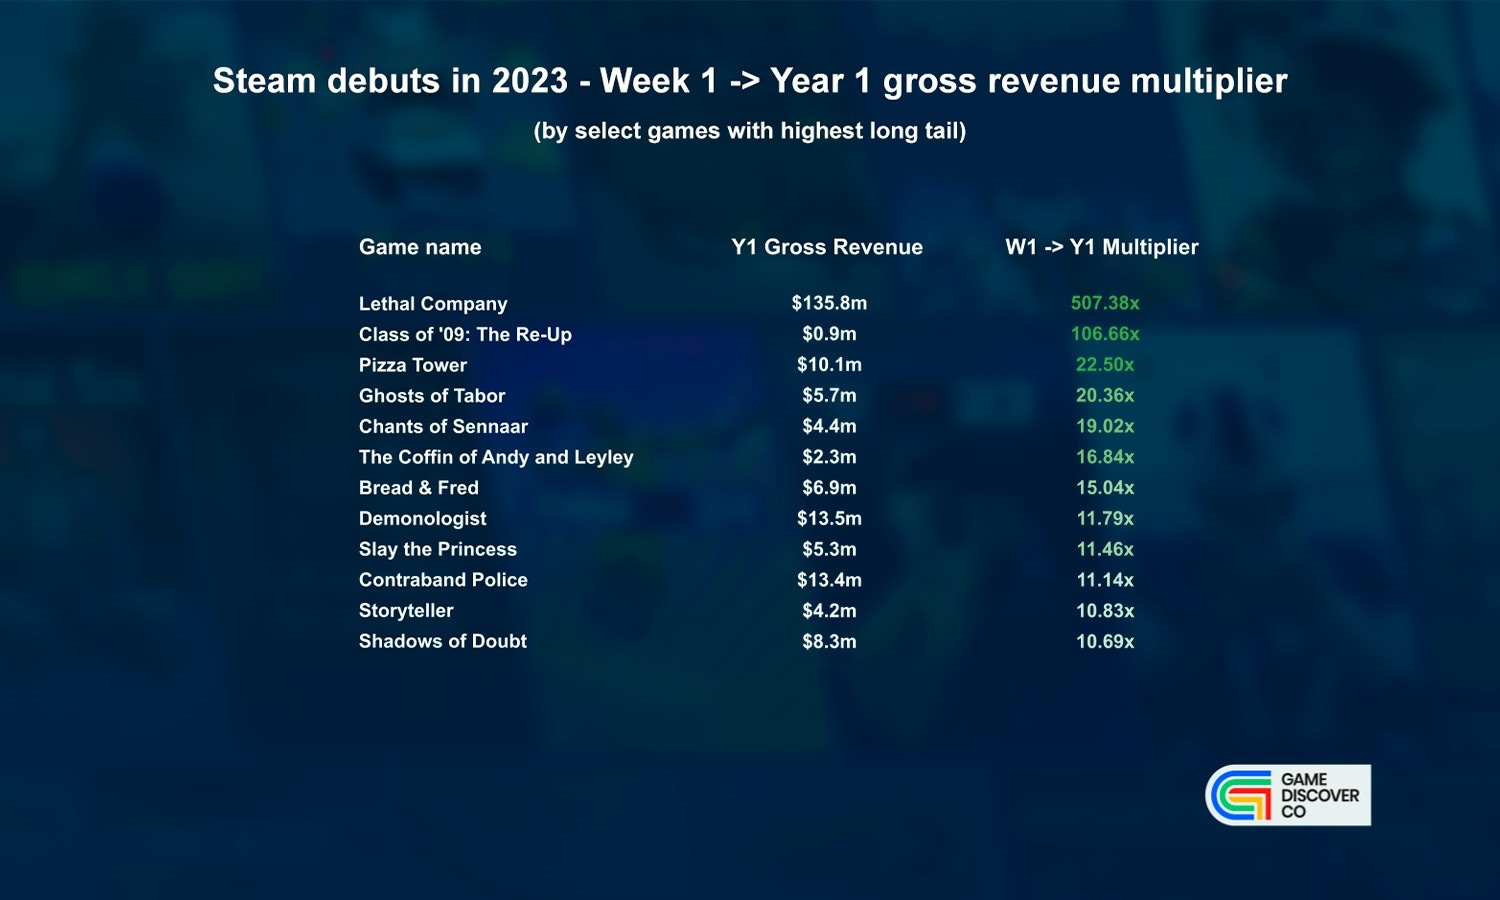
There’s some expected - and some unexpected - titles on this list, huh? Just trying to classify them briefly, we have:
Games that went ‘viral’ after release: this is rare. But co-op proximity chat goof-em-up Lethal Company(507x W1 revenue!) had ~3k CCU during launch week, but got as high as 240k CCU later. And high school visual novel Class Of ‘09: The Re-Up(106x W1) was ‘discovered’ by key influencers, months later. Storyteller (10.8x) also had some major TikTok interest quite a bit after release…
Co-op/multiplayer titles that keep strong virality through player base: based on ‘go play with friends!’ & continued streamer support: see Phasmophobia-ish Demonologist (11.7x W1), ‘tethered together’ masocore 2D platformer Bread & Fred (15x W1), and standout PvPvE VR extraction shooter Ghosts Of Tabor (20.3x).
Great games that keep getting ‘word of mouth’ props: they don’t always launch huge, but you can get >10x Year 1 revenue compared to Week 1 if people really love you: see Pizza Tower(22.5x W1), Chants Of Sennaar(19x), Slay The Princess(11.4x), and Shadows Of Doubt(10.7x).
And remember, all these great titles aren’t the highest-grossing ones in their first 12 months - they just outpaced their early sales numbers! On the other hand, some games got a less great W1 → Y1 multiplayer. Let’s check ‘em:
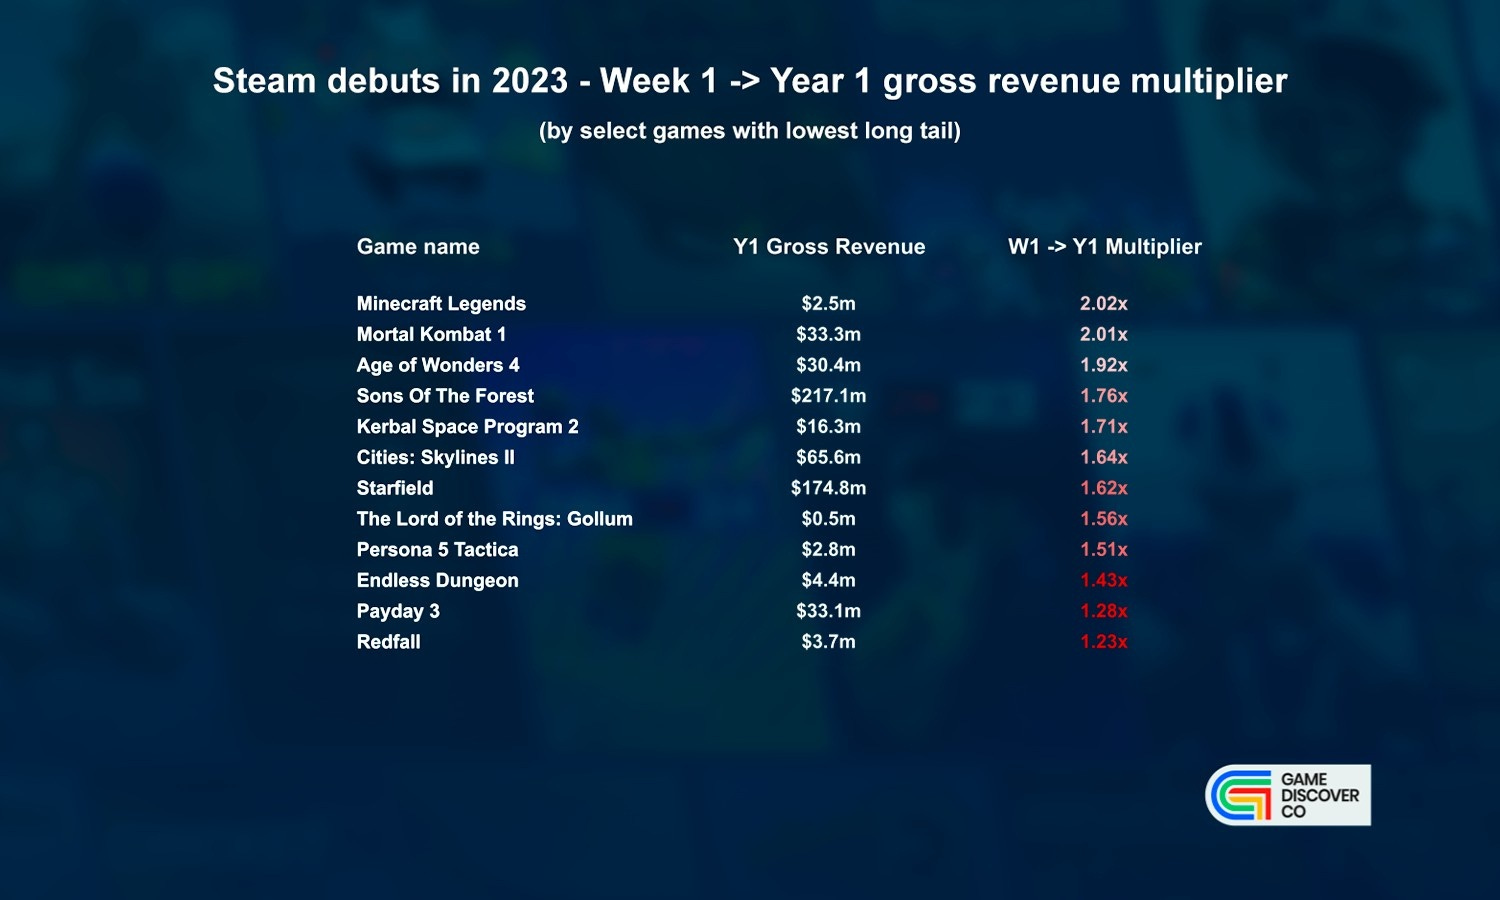
Again, this is a mix of titles that you’re largely not surprised by. But there may be a few eye-openers in here. We see the following:
Games with very strong pre-orders and a limited wider audience: pre-orders will bulk up W1 revenue ‘unfairly’. Sowe’d classify Starfield(Y1 = 1.62x W1 revenue) as an example, and the disappointingly received Redfall(1.23x) a more obvious example. (Perhaps being in Game Pass to try & marginally reviewed also matters?)
Titles that failed to follow through on their promise: these also had strong pre-orders, but the result wasn’t quite what people wanted: see Kerbal Space Program 2(1.71x), Payday 3(1.28x), and Cities: Skylines II(1.64x). All have hefty Y1 revenue numbers, though! (The Lord Of The Rings: Gollum - at 1.56x - less so on Y1 $.)
Perfectly good games which just had a LOT of early fans: The Forest sequel Sons Of The Forest(1.76x) has Very Positive reviews and great revenue, it’s just quite frontloaded because so many fans wanted to jump on early. The same’s also true of Age Of Wonders 4 (1.92x). Not a major problem? But still a lower multiple.
So yep, it’s really not as easy as ‘low multiplier bad, high multiplier good’. But there’s some elements of that in there, sure. And while looking at outliers is fun, your next question might be - what should i forecast for long tail? You know, for me, the person I care about the most? And we can take an extra look at that…
‘Long tail’ trends for 2024: what you should expect
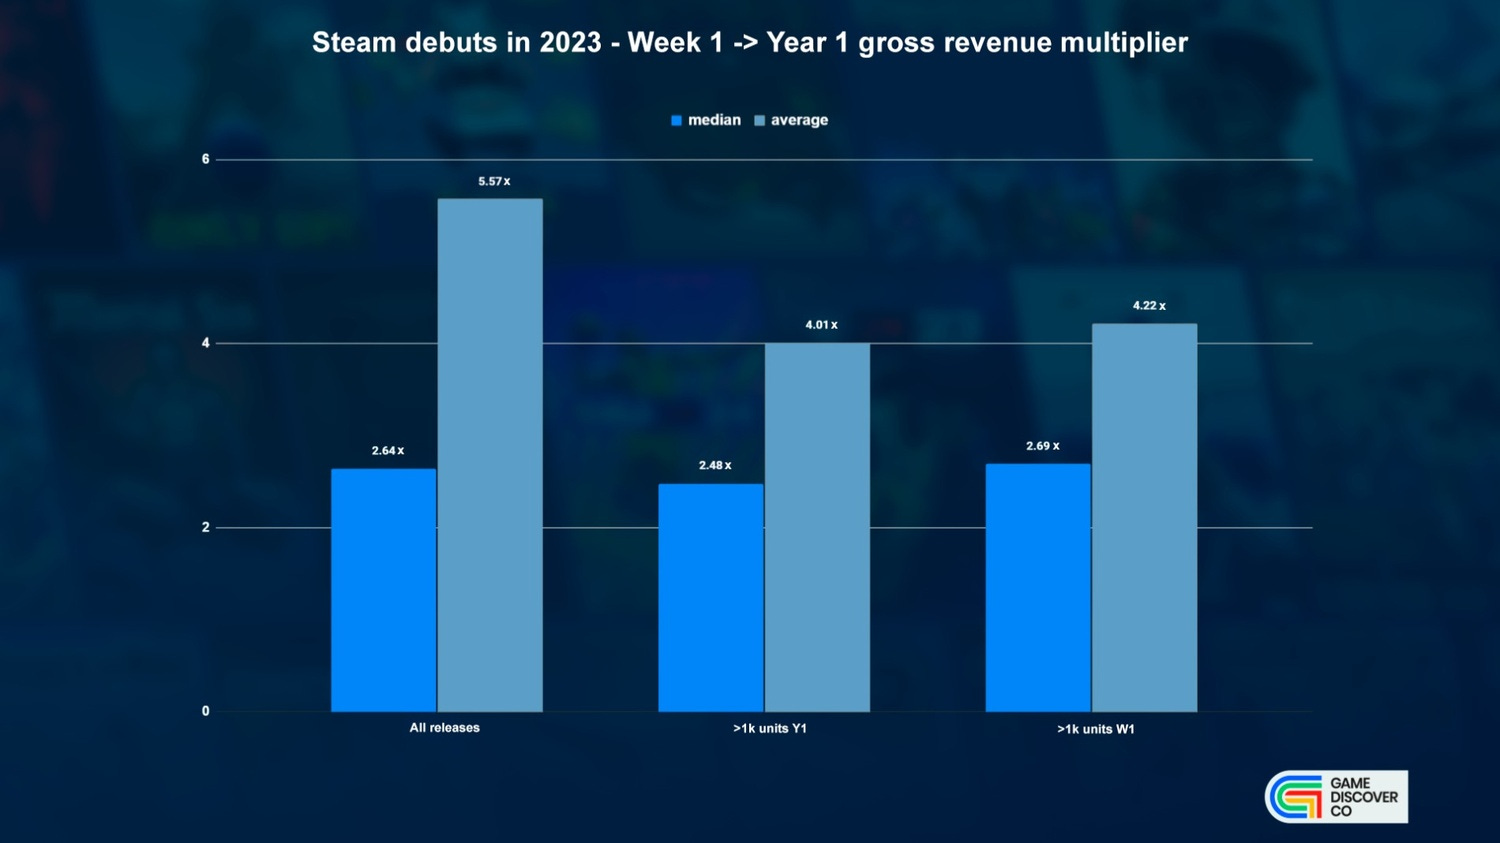
Honestly, a problem with analyzing data like this is that there’s so many outliers and ways to slice it. How about the game that sold 2 copies in Week 1 and another 20 later on? So here’s three overviews of the ‘Steam games in 2023’ data to start (above):
Across all games debuting in 2023, we see a 2.64x Week 1 to Year 1 median revenue multiplier. (The median = the 50th percentile ‘middle’ result.) The average is way higher at 5.57x, due to aforementioned outliers. (We don’t like average.)
If we cut things only by games that sold >1,000 units in Year 1, the median decreases slightly to 2.48x, and the average goes down to 4.01x. (Less weird outliers!)
Finally, if we get more aggressive and limit things only to games that sold 1,000 copies in Week 1 on Steam, the median goes to a 2.69x Year 1 revenue multiplier, and the average is 4.22x. (We’re sampling more successful games.)
You’ll note that this is all somewhat lower than the 3.16x median multiplier in last year’s ‘long tail’ survey using data from GameDiscoverCo readers. This is probably because more successful games are likely to respond to surveys, right? (Or our externally-sampling algorithms are somehow suppressing the multiplier a bit.)
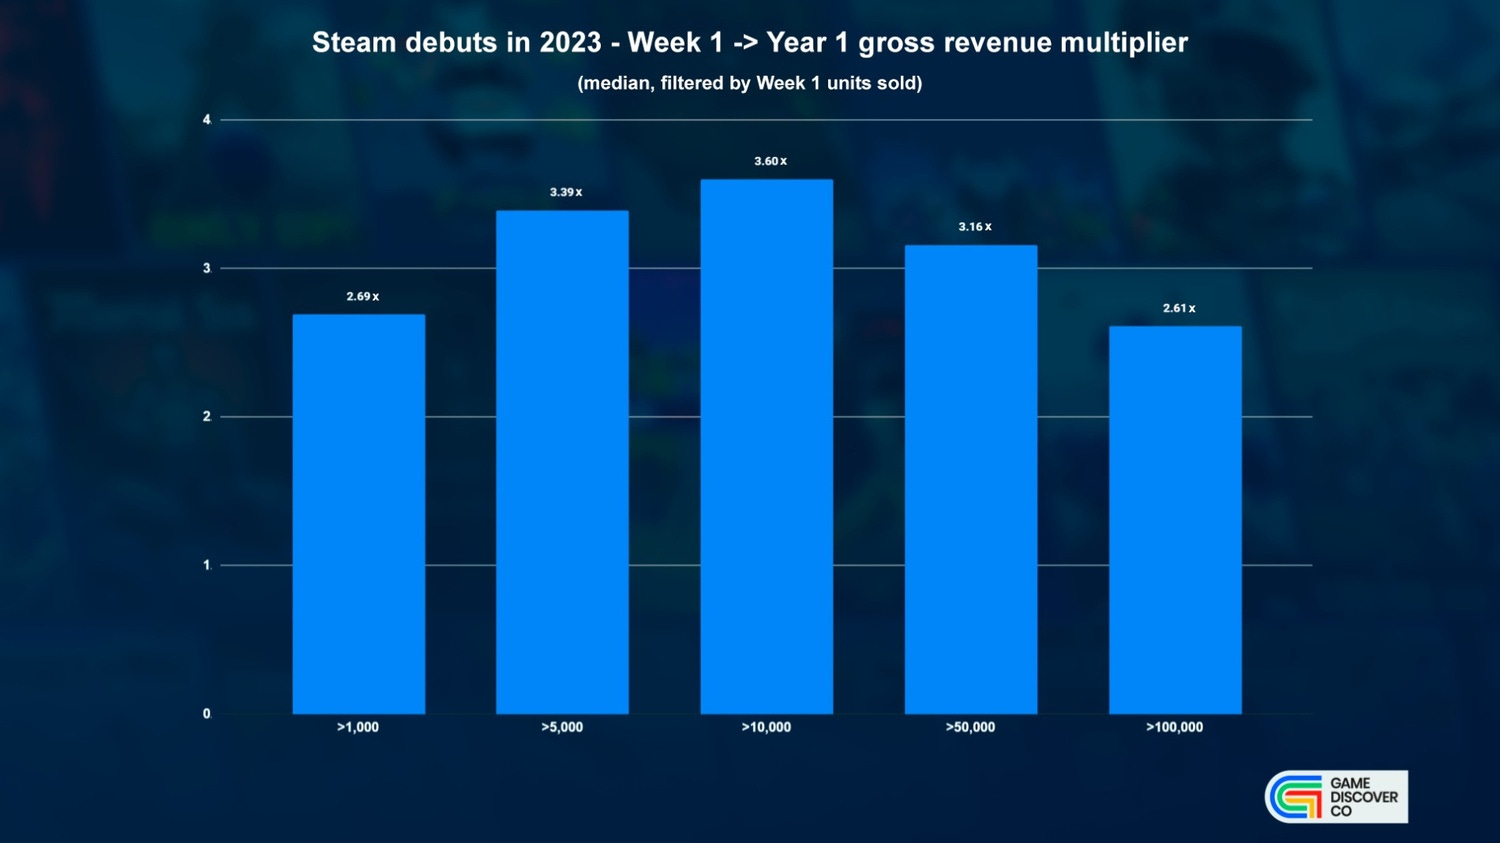
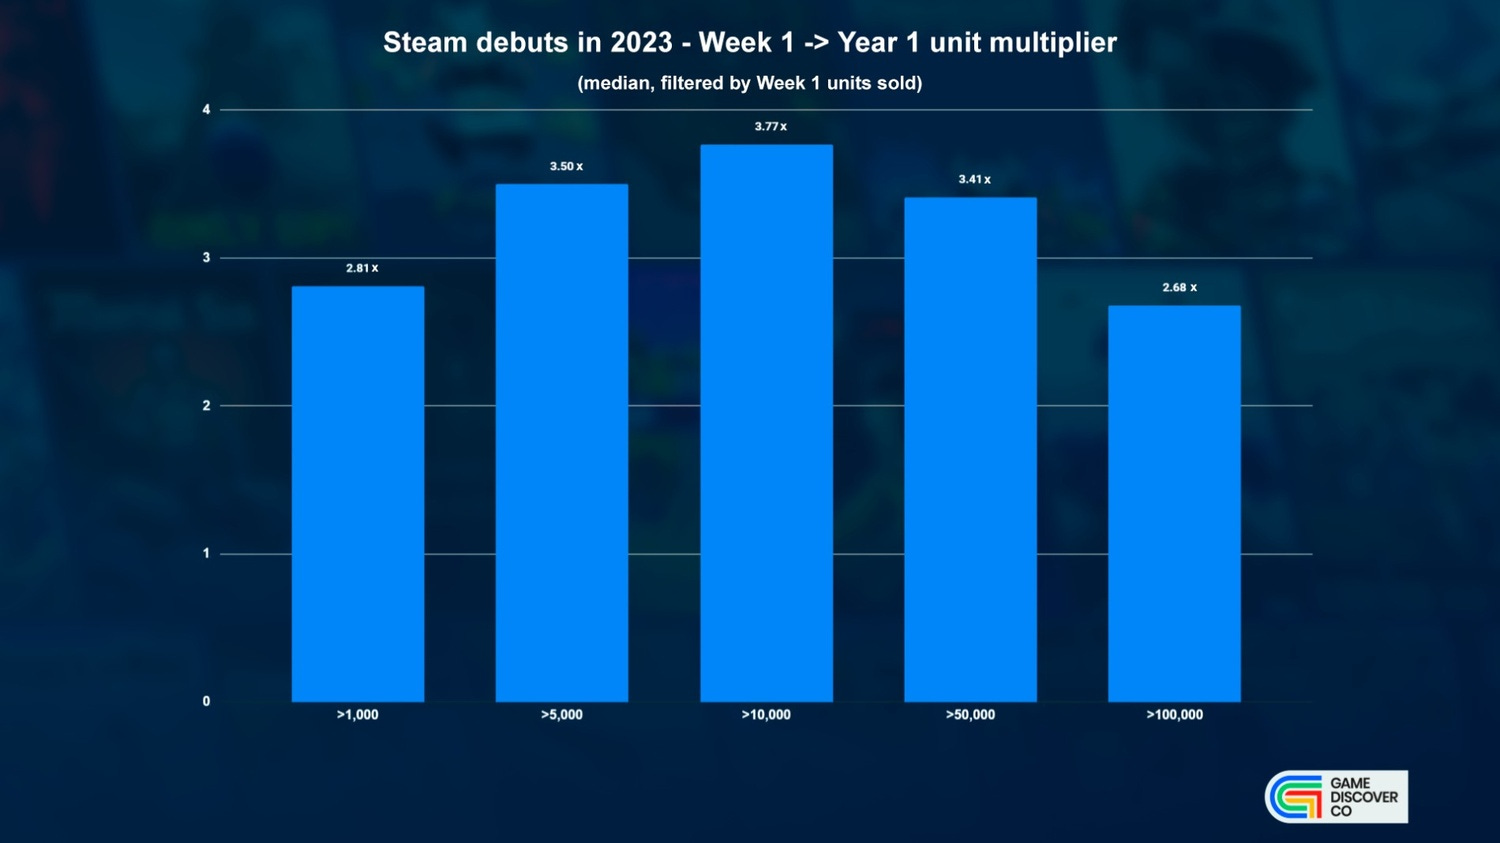
How about if your game is more successful in terms of Week 1 sales? You’ll see here that games with >1,000 Week 1 sales have a 2.69x Year 1 median revenue multiplier, but it goes up to 3.39x for >5k sales and 3.6x for >10k sales, before coming down to 3.16x for >50k sales and 2.61x for >100k sales.
Why the lower multiplier for bigger sellers? Probably the effect of pre-orders on some of the largest games, as well as the fact there’s just less upside from people finding out about your game later, if they already know about it.
We were also curious about copies sold. So we made the same graph, but for median units sold multiplier in Year 1, as opposed to median gross revenue multiplier. The results were a bit surprising to us - despite a similar overall shape:
We’d tended to believe that discounts meant you’d sell quite a few more copies of games in Year 1. In our brain, you might sell 20%+ more units compared to revenue. But we forgot two things:
The first-week of a game’s sales - often 30-40% of the first year sales - are typically at a 10%+ launch discount.
Most of the discounts in the first year on Steam are often in the 20-25% range, meaning that the average price isn’t THAT much reduced.
So while we’d expect the difference between revenue multiplier and units multiplier to be accentuated in Years 2 and 3, we’re only seeing about 5% more ‘unit increase’ than revenue (2.81x median compared to 2.69x) for titles selling >1k units in Week 1. The biggest difference is 7%, for games selling >50k in Week 1.
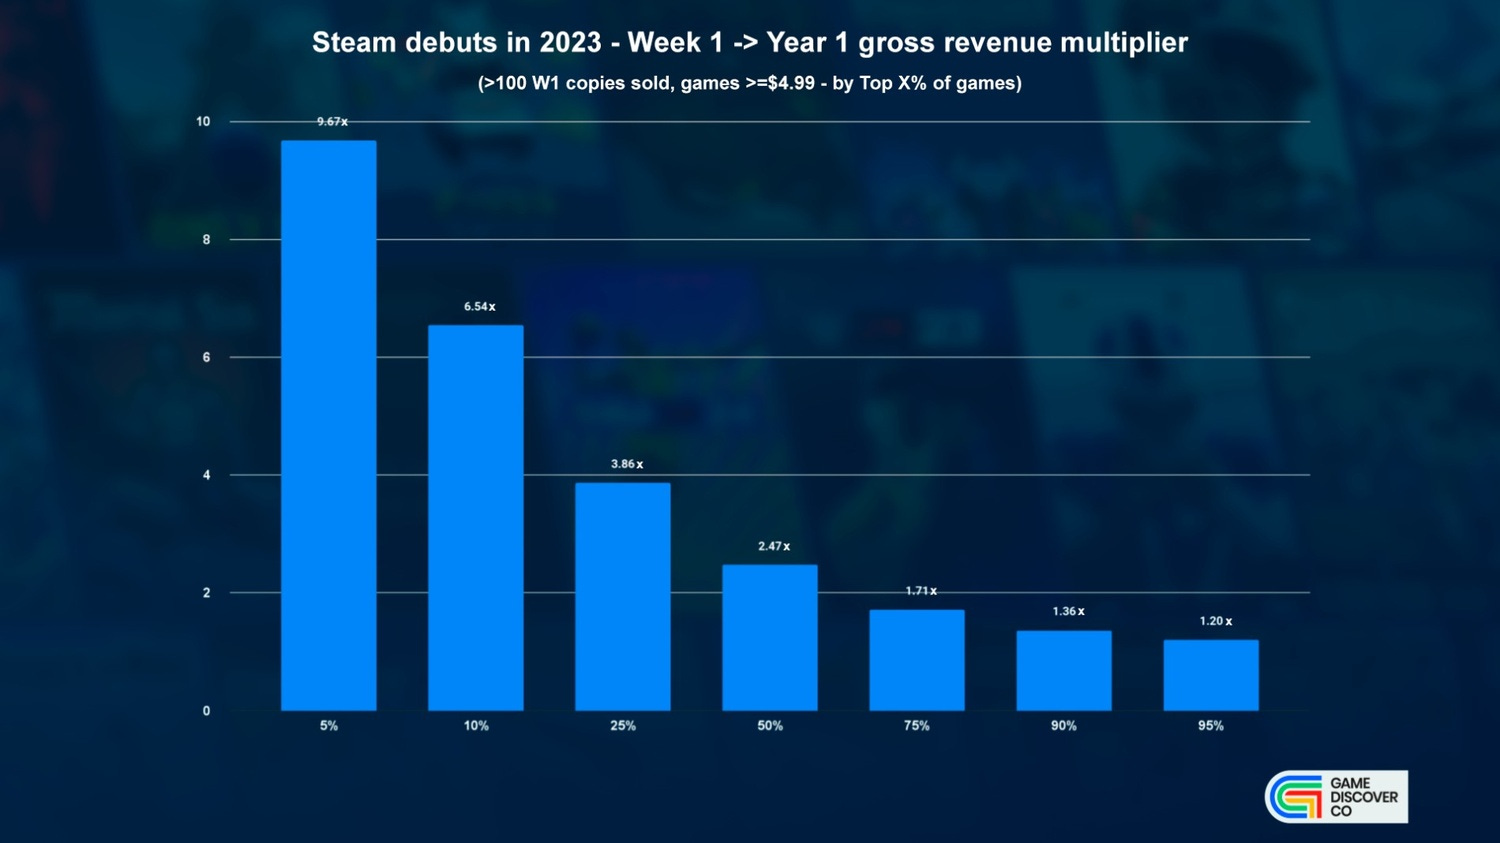
Finally, maybe you want to understand the various scenarios of ‘Week 1 to Year 1’ revenue multiplier? Above is that data, with the caveat that we’ve only done a very light game filtering - titles that cost $4.99 or more and sold >100 copies in Week 1.
So your average commercial game is likely to be in a somewhat tighter multiplier range - maybe the <2x to >6x range we cited in the 2024 opt-in survey. But nonetheless, this gives you a good basic idea, with:
The Top 50% (median) result shows Year 1 revenue of 2.47x Week 1 revenue.
The Top 25% game had a 3.86x multiplier, with the Top 10% title at 6.54x and the Top 5% at 9.67x. (Lots of outliers when you get that high!)
Conversely, the Top 75% (bottom 25%!) title had a 1.71x multiplier, Top 90% (bottom 10%!) at 1.36x, and Top 95% (bottom 5%!) at 1.20x. That’s the low end.
So there you go - some extra mindboggling data so you get an idea of what money you might expect over time for your Steam game. And yes, this multiplier has been going down over time, since there are many more games to choose from on Steam. (Legend has it that it was as high as 6x median back in 2017. Ah, the halcyon days of old…)
[We’re GameDiscoverCo, an analysis firm based around one simple issue: how do players find, buy and enjoy your PC or console game? We run the newsletter you’re reading, and provide real-time data services for publishers, funds, and other smart game industry folks.]